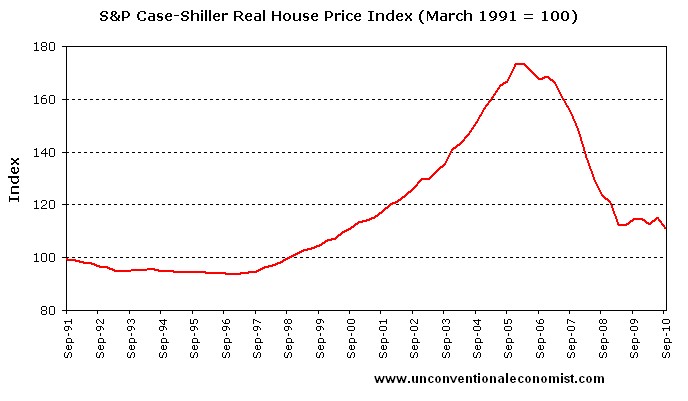
Last week, the United States Case-Shiller 20-cities Composite house price index took an unexpected plunge, falling 1.3% in October from a month earlier. Prices have now fallen by around one-third (see below chart).
Month-over-month prices fell in all metro areas covered by the index. And in six markets – Atlanta, Charlotte, Miami, Portland, Seattle and Tampa – house prices have reached their lowest level since the housing bust began in 2006 and 2007.
The destruction of household wealth since 2007 has been shocking. According to the Federal Reserve, household net worth has declined $11 trillion from its peak in 2007. Relative to GDP, household net worth has fallen from around 470% in 2007 to around 375% currently. In fact, household net worth is currently near its long-run average level prior to the stock market and housing bubbles (see below chart from Calculated Risk).
Much of the destruction of household wealth is due to the decline in housing values. United States housing values as a percent of GDP have fallen considerably and are not far above historical levels. However, mortgage debt as a percent of GDP remains near historically high levels, suggesting more deleveraging ahead for households (see below chart from Calculated Risk).
The unspoken truth:
As bad as last week’s housing data was, the 20 cities that comprise the Case-Shiller Composite Index are not representative of the entire United States housing market. In fact, the United States housing bubble/bust was confined to only a minority of cities. To illustrate this point, first consider the below chart, which compares the 10-city Case-Shiller Composite Index against the FHFA House Price Index based on 50 states (chart courtesy of Carpe Diem).
As you can see, the United States housing bubble/bust was confined, to a large extent, to the 10 cities making up the Case-Shiller 10-city Composite Index, namely: Boston, Chicago, Denver, Las Vegas, LA, Miami, NYC, San Diego, San Francisco, and Washington D.C.).
So why was their so much variability in house price performance between United States cities, with some cities booming then busting while other cities remained relatively stable? It’s certainly wasn’t due to liberal lending policies (easy credit), since essentially the same lending conditions were available across the United States. It wasn’t because of differences in population growth, since states like Texas, which has experienced the highest population growth over the past 10 years, never had a housing bubble/bust. Rather, the differences in house price performance are accounted for by the way in which these markets regulate land use.
The below table, which comes from Demographia’s 6th Annual International Housing Affordability Survey, shows the extent to which the various housing markets employ restrictive land use regulations.
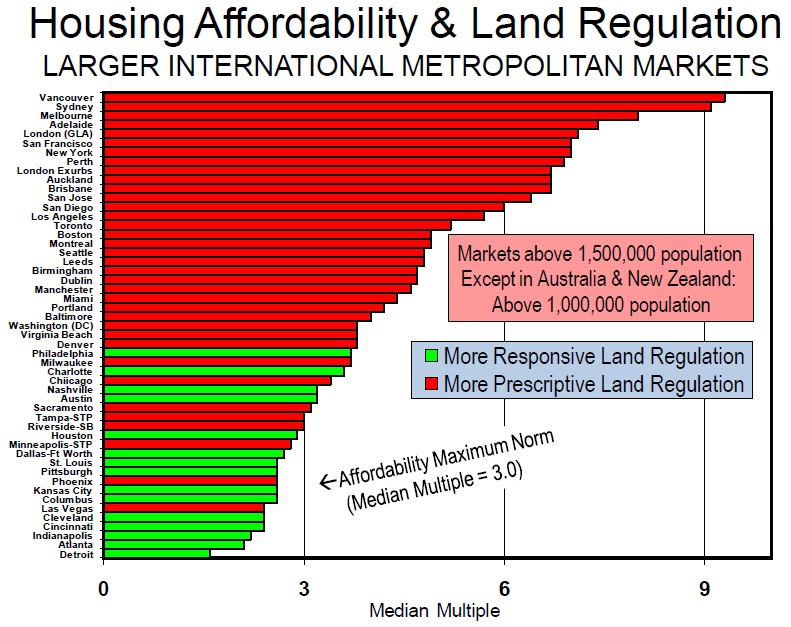
Restrictive land use regulation, often referred to as “smart growth”, “growth management”, or “new urbanism”, refers to policies that force people to live in higher densities while significantly restricting the expansion of suburban residential development. Measures include, but are not limited to, urban growth boundaries, areas declared off-limits to development, building moratoria, development fees and charges, and excessively large minimum lot sizes.
Cities that have adopted liberal market-based approaches (‘more responsive land regulation’) have experienced relatively stable housing markets, whereas those that have implemented prescriptive land use regulations have experienced volatile boom/bust cycles.
To illustrate this point, first consider the below chart, which plots the CPI-adjusted house price performance of the cities included in the 20-city Case Shiller Composite index and deemed by Demographia as having “more prescriptive land regulations”.
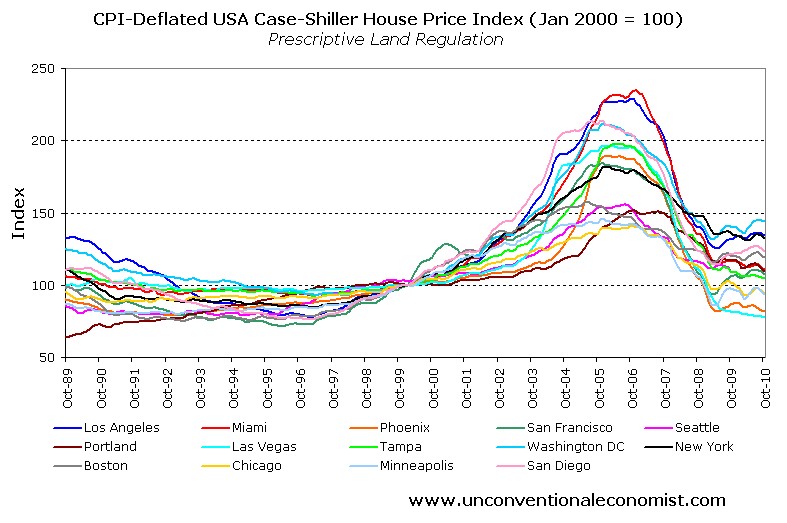
As you can see, prices have been highly volatile, with all cities experiencing wild boom/bust conditions.
Now consider prices in the cities within the 20-city Case-Shiller Composite Index with “more responsive land regulations”.
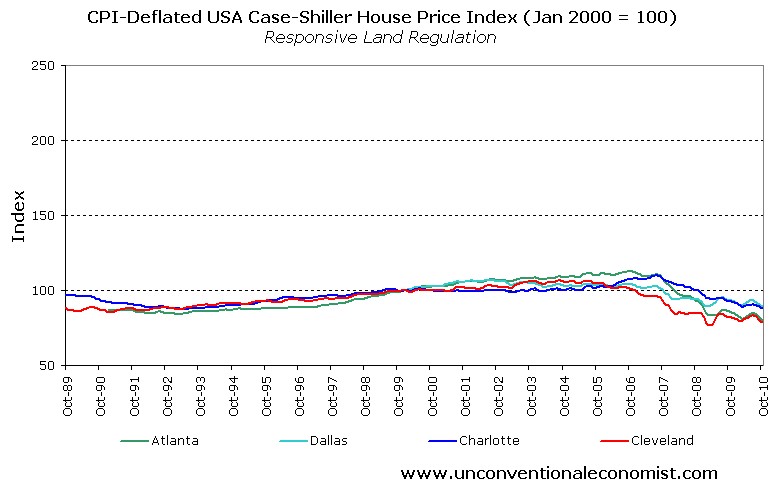
As you can see, real house prices have remained relatively stable in the supply responsive cities.
The situation is similar at the state level using FHFA housing data. First, consider the states with “more prescriptive land regulations”:
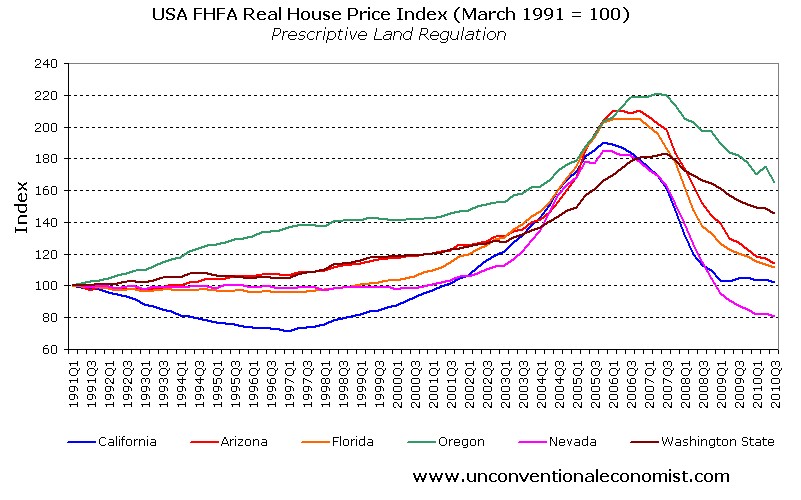
Now consider states with “more responsive land regulations”:

Again, it’s the same story, with the highly regulated states experiencing wild boom/bust cycles whilst prices in the market-oriented states remained relatively stable.
Economics 101:
The economic forces underpinning the above findings are perhaps best explained through basic supply and demand analysis. Consider the below chart taken from an earlier article on this issue.

Q0 and P0 represent the initial equilibrium situation in the housing market. Initial demand is provided by D0, whereas supply is shown as either SR (restricted) or SU (unrestricted), depending on whether land supply constraints exist.
Following an increase in demand, such as a significant relaxation of lending standards, the demand curve shifts outwards from D0 to D1. When land supply is restricted, house prices rise sharply from P0 to PR. By contrast, when supply is unrestricted, prices rise more gradually from P0 to PU.
The situation works the same way in reverse. For example, if there was a sharp fall in demand following a contraction in credit availability or a sharp rise in unemployment, causing demand to fall from D1 to D0, then prices fall much further when land supply is constrained.
The key point is that increases (declines) in demand can bring sharply rising (falling) house prices when supply is constrained. However, when land supply is not regulated, it adjusts to demand and house price volatility is reduced.
These observations are consistent with those of Glaeser and Gyourko, who summarised the findings of a number of studies in this area:
Recent research also indicates that house prices are more volatile, not just higher, in tightly regulated markets.
…price bubbles are more likely to form in tightly regulated places, because the inelastic supply conditions that are created in part from strict local land-use regulation are an important factor in supporting ever larger price increases whenever demand is increasing.
…it is more difficult for house prices to become too disconnected from their fundamental production costs in lightly regulated markets because significant new supply quickly dampens prices, thereby busting any illusions market participants might have about the potential for ever larger price increases.
Learning history’s lessons:
As long as commentators focus primarily on the demand-side of the housing market, whilst ignoring supply-side constraints, they will never fully understand the drivers of housing bubbles and busts. The resulting incorrect diagnosis will inevitably lead to poor policy prescriptions and outcomes.
By all means, let’s crack down on the destructive speculation, predatory financing and financial alchemy that has fuelled the world’s housing bubbles. At the same time, let’s not ignore the supply-side barriers that have enabled the credit-fuelled demand to feed into skyrocketing house prices which, in the case of the United States, later collapsed once the artificial demand evaporated.
Readers seeking detailed information on issues pertaining to the supply-side of the housing market are encouraged to visit the Demographia and Performance Urban Planning websites. Also, please be advised that the 7th Annual Demograhia International Housing Affordability Survey will be released on 24 January 2011. It’s sure to be another great read.
Cheers Leith
