As part of my “Crashlist” I regularly follow the spot price (in USD) for gold, silver and oil as they are the three benchmarks that measure the strength of the global economy, the value of the US dollar and the speculative excess inherent in modern global markets.
Bullion Baron has some great insight into these “standards” and their relationship in two recent posts, particularly on the subject of when they transition from bull markets into blow-offs and what the “Macro” investor can do to spot such a change.
Gold/Oil and Silver/Oil Ratios Previously, I wrote about the geopolitical situation in the late 1970s and how that was similar to what we are seeing now, I also proposed that we might also see an energy crisis come out of the Middle East situation, so I’ve decided to have a look at the ratios between Gold/Silver and Oil to try and guess where we might see prices end up in a similar blow-off peak.
The WTI Oil price data came from Economic Research section on the Federal Reserve Bank of St.Louis website. The Gold and Silver price data came from the Perth Mint, I used the monthly London Fix (PM) Average. It’s worth noting that the charts and data I am using are monthly, so they will not be the absolute peaks, but in reality I would prefer to use monthly as I think it would be an unrealistic expectation for most to be able to trade, exit or enter positions at the daily peaks/troughs.
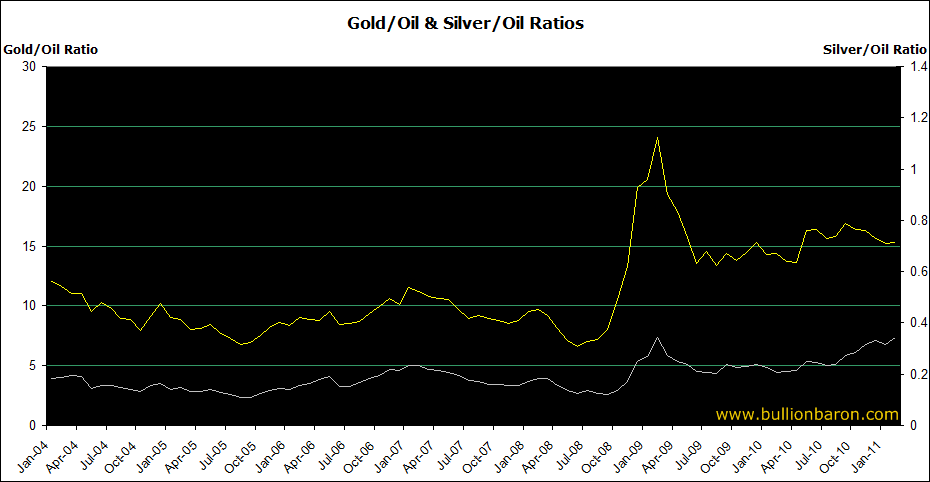
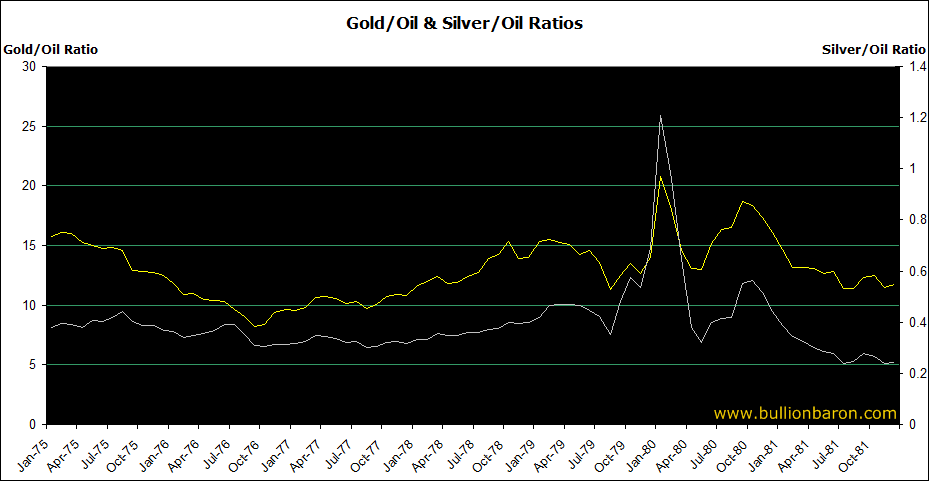
Here are the charts. The first depicts January 1975 to December 1981. The second depicts January 2004 to February 2011. (click twice to enlarge)
So in the charts above we can see that Gold peaked at a ratio of just above 20 (20.77) to Oil in January of 1980. Silver peaked at a ratio of 1.20.
Over the period of 1978 to 1980 we saw the price of Oil better than double. It moved from $14.85 at the start of 1978 to $39.50 in April 1980 (it was $32.50 at the Gold/Silver ratio peaks in January 1980).
Today we are seeing expectations of a similar move in Oil prices (almost doubling in price) as the Middle East troubles develop.
Crude prices will touch $200 a barrel if the Arab revolution spreads to Saudi Arabia, the Centre for Economics and Business Research (CEBR) said on Friday.
… the revolutions around the Arab world have pushed up the price of oil which had temporarily stabilised at $116 yesterday. This is 38% above its average level for 2010. And if the unrest spreads to the Gulf states and Saudi Arabia, the price could rise to $200 easily…
If Oil at $200, where for Gold and Silver? If we were to see Oil at $200, where might we expect Gold and Silver to be relative to the price of Oil given similar ratios to the peak in January 1980?
The price of Silver at a ratio of 1.2 to Oil with Oil at $200 = $240
The price of Gold at a ratio of 20.77 to Oil with Oil at $200 = $4154
Of course Silver’s peak in January 1980 was also partially the result of the Hunt Brothers attempt to corner the market, perhaps a fairer ratio to use would be that seen later in October 1980 which was a Silver/Oil ratio of .56, which would translate to a Silver price of $112 with the same ratio and Oil at $200.
Of course it’s just speculation that Gold/Silver will reach exactly the same ratios as seen in 1980 or that Oil will reach $200 in the near future, however the Middle East unrest seems far from over and I think an energy crisis developing and the prices mentioned above being reached are a definite possibility.
Silver spiked and closed above $35.50 last night, a new intraday and daily close record for the current bull market. I suspect the rise that we see over short to medium term is going to absolutely blow minds, many will miss out and buy too late on the way up. The blowoff peak is likely to see an almost as shocking correction on the other side, so it is important to be ready to sell, have an exit plan and put it into action when your targets are met.
He makes a valid point that this comparison analysis is just speculation – I too am wary of linking one chain of events from previous economic and monetary era to the current day system: most of which no one truly understands how it works.
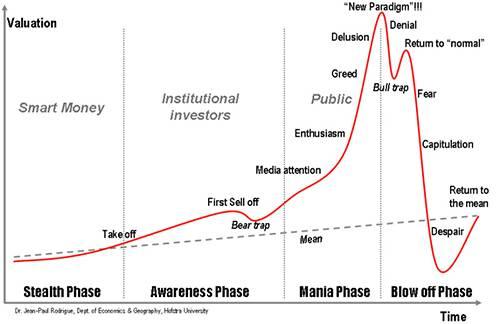
Regular readers will have seen this “Phase of Bubble” diagram before:
Where is gold/silver now? Or the AUD?
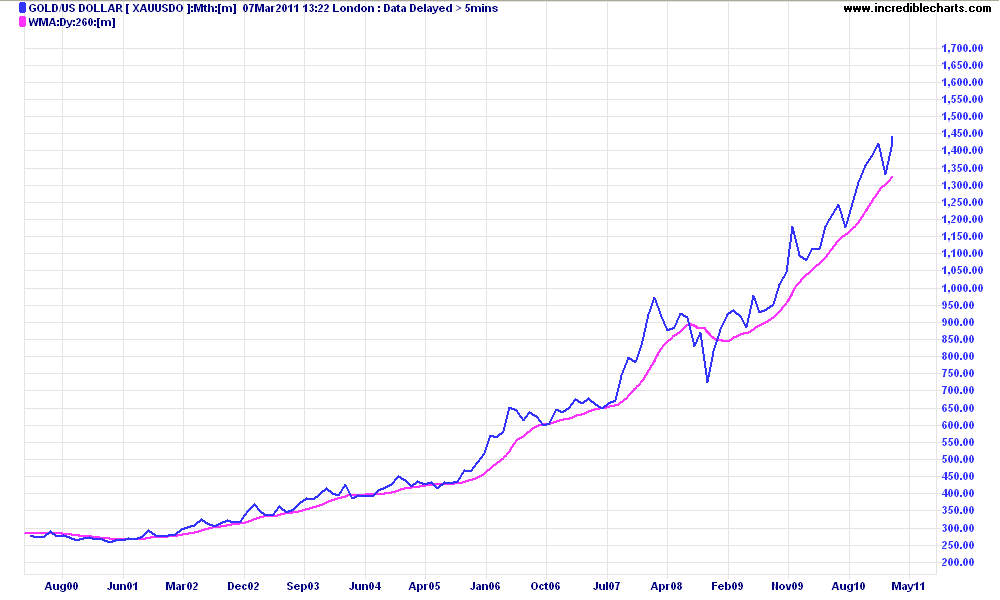
It is easy to quickly compare the gold price to this diagram, and make a subjective judgement of what phase it may or may not be. This linear scale chart of the 10 year bull market in gold (in USD) gives a solid indication.
Was the GFC the Bear Trap?
Technical and charting analysis (plus monetary analysis of the money supply, interest rates and the real rate of inflation) all help the trader and investor alike in picking changes in trends or an acceleration of an underlying trend.
But sometimes, the best indicators are more public, as BB continues:
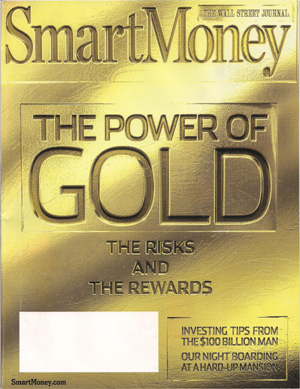
The Mania Phase The hysteria around Gold and Silver at the peak of the mania phase is likely to be intense and hard to ignore, so it’s important to be mentally prepared for it. One of the most prominent that I came across today, was this recent front cover to SmartMoney magazine:
Granted it’s more about selling Gold (and not getting ripped off), than buying, but they do cover the investment side of it briefly at the start of the video.
Gold and especially Silver have been getting an increasing amount of media coverage as they continue to rally out of their early year lows. Especially now that the rest of the market is tracking sideways/down the spotlight is on Gold and Silver as they continue to rise in the unstable conditions that the Middle East/Northern Africa troubles are presenting.
I am still of the opinion that Gold/Silver are on the verge of going truly parabolic within the next couple of years. As I’ve pointed out previously, in the last 2 years of the last Gold bull market the price Quintupled ($169 to $850) and I suspect this bull market will end with an equally impressive move.
I am no Michael Pascoe-bashing gold bug commentator – far from it. I contend that gold may have a legitimate place in a future monetary system, given that the likely path to a sustainable non-debt based economy may require a deflationary gold standard.
But as a trader and empiric investor, I see gold, silver and oil for what they are and how they behave: speculative commodities, whose price activity is supported by fundamentals, but the trend is completely beholden to the vagaries and behaviour of market participants (i.e traders, hedge funds, and “the crowd”) and non-participants (e.g the Princes on Martin Place) alike.