
It’s time for another trip down memory lane. It’s September 2007 and home prices in London have just started to fall, but are still holding up nationally (see below chart).

UK households are growing increasingly nervous. After embarking on an almighty borrowing binge over the 2000s, as evident by household debt to disposable incomes rising from around 100% in 2000 to nearly 160% (see below chart), finances are stretched, leaving households vulnerable to a deteriorating economy and rising unemployment.

Opinions are divided on the future trajectory of home prices. Industry spokespeople are publicly maintaining the faith, arguing that the underlying strength of the UK economy will ensure that prices, at worst, stagnate as incomes catch-up. By contrast, some analysts are predicting falls of 15% to 40% and a deep recession.
An article published on 12 September 2007 by Money Week’s James Ferguson, entitled Has the house price crash finally begun?, sums up the mood nicely:
If it looks like a duck, walks like a duck, swims like a duck and quacks like a duck, as the old saying goes, it most probably is a duck. The same principle applies to the present house price crash in London. In the last two months, the average house price in London has fallen 5%. In the context of the massive rises in house prices over the last few years this doesn’t sound like much, but consider this: if prices in the capital keep falling at this rate, they will have fallen 30% from their peak by this time next year. And that would look rather like a house price crash. There aren’t many who think this will happen (there are still armies of industry spokesmen out there assuring us that residential property is still a good long-term investment, and that prices will, at worst, just level off and stay flat), but I do think it is time to take the risk seriously…
Unlike last summer, this summer has seen a significant excess of properties coming onto the market compared to those coming off. Not only that, but the number coming off the market is way down on a year ago too…
The question to ask ourselves now is, “What does a property crash look like?” The answer first of all is that it doesn’t look like a stockmarket crash, at least not at first. Property is illiquid, so everything happens in slow motion. Take Rightmove’s price data. This records sellers’ asking prices, not the prices they actually sell at. Indeed, Mira Bar-Hillel, writing in the Evening Standard, quotes Russell Jervis of estate agent Haart as saying, “We have been advising asking-price reductions of 7% to 10%… due to there being fewer buyers.” There are a lot of sellers out there who won’t have been able to bring themselves to do that yet…
Another sign (and this is my favourite) is non-stop industry denial. Property insiders are predicting a gentle slowdown in the UK’s housing market, just as they did in 1989. The Royal Institution of Chartered Surveyors asserts that low rates and low unemployment mean a crash “is not on the horizon”. This, despite the fact that unemployment was also at a decade low in 1990. It didn’t prevent a crash then. In fact, the crash in property and consequent recession were what then sent the unemployment rate up from a ten-year low of 6.8% in 1990 to more than 10% by 1994. To me, the extent of the denial is as good as confirmation…
Most commentators who were bullish earlier in the year are now content to predict flat prices for several years as wages play catch-up…
Analysts who do accept that a crash is likely (those with no vested interest in property) predict price falls of anywhere from 15% to 40%, probably kicked off by the wholesale selling of properties by the buy-to-let investors. But how long will it take? Even some bears such as Roger Bootle of Capital Economics expect the fall in property prices to only last a year or so, since they expect recession to lead to interest rate falls by 2005.
However, once property crashes start they are hard to stop, even with rate cuts. The first half of the 1990s saw rates halved, the cuts starting almost as soon as the property crash got under way, yet prices continued to fall. If it takes the rest of this year for sellers to adjust to the new rules and all of next for them to adjust their asking prices down to the clearing level, it will take at least all of 2007-8 to rally enough buyers to sort things out. If a crash really gets under way, don’t expect it to end before 2008 – at the earliest.
The rest is history:
We all know what happened next. UK home prices fell by 21% over an 18 month period before recovering slightly, and are now 18% lower than at their peak (see below chart). Of course, with inflation having risen 12% since September 2007, the fall in real terms is far greater.

With the fall in home prices, the UK’s highly indebted households felt poorer, eroding consumer confidence and their willingness to spend (the ‘wealth effect’). And with many households moving into negative equity, they had little choice but to tighten their belts and begin the process of debt repayment (‘deleveraging’).
This process, whereby UK households shifted from borrowing/consuming to saving/debt repayment, is illustrated clearly by the below Bank of England chart, which shows home equity withdrawal (HEW) moving from positive to negative in Q2 2008. According to the Bank of England, households have injected £49.7bn into housing equity since the HEW measure turned negative.

The deleveraging process is also evident by the ratio of household debt to disposable income falling from a peak of 161% in Q1 2008 to 149% as at Q1 2010 (see below chart).

With UK households tightening their belts, sectors reliant on consumer spending began to contract and unemployment rose. Consumer confidence continued to fall, leading to ongoing frugality, house price weakness and job losses (see below chart).

Relevance to Australia:
Whilst each housing market is different, there are clear similarities between the UK situation in late 2007 and Australia currently, including:
- low unemployment (5.2% in the UK; 4.9% in Australia);
- high levels of household debt (nearly 160% of household disposable income in both countries);
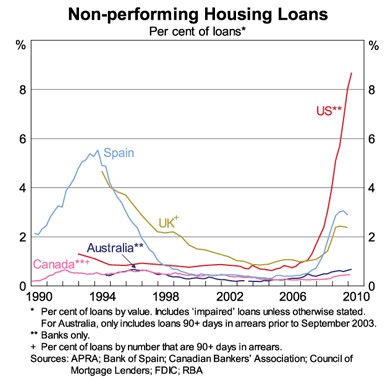
- low rates of mortgage arrears (click to view chart);
- substantial supply-side constraints;
- a significant increase in the number of homes coming onto market;
- a significant reduction in the volume of sales;
- discounting by vendors; and
- constant denial by industry vested interests that the housing market is in trouble.
There were some differences too. The UK housing crash in part developed momentum because its banks were caught in the contagion of the global shadow bank freeze that started in the US. The subsequent credit rationing made everything worse.
The point is, however, that it’s never certain what the trigger will be. The only certainty is that so long as valuations and debt levels are so overstretched then a trigger is all it takes.
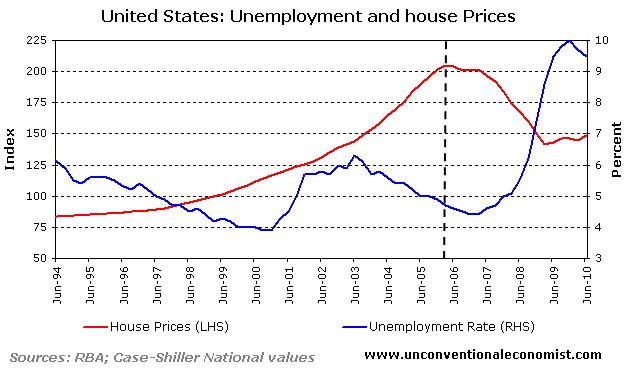
The most important lesson from the UK experience for prospective housing buyers is that unemployment did not surge until mid-2008 – around a year after house prices began falling. This is similar to what happened in the United States, where house prices fell for a year before unemployment began to rise (click to view chart).
Think about the UK experience the next time a housing industry representative claims that Australia’s housing market is underpinned by sound fundamentals like low unemployment and, as a result, house prices won’t fall.
Then ask yourself: is Australia really that different?
Cheers Leith
unconventionaleconomist@hotmail.com
