
I think the AUD/USD exchange rate has made a medium term top at 1.1013 which is associated with what appears to be a turn in the USD and other markets at present.
Turning points are never easy times for markets as the previous bulls cling to their tendencies and the emerging bears are a bit shy of using the full force of their conviction for fear of getting stampeded, Pamplona style. It makes for skittish trade, which is what we are seeing at the moment particularly in the AUD which traded in a 3 cent range in the past 2 days in particular and last week in general.
So I thought it worth a quick look at the technicals to see what the price action is telling us, if anything.
This first chart is the hourly of the AUD/USD for the past month.
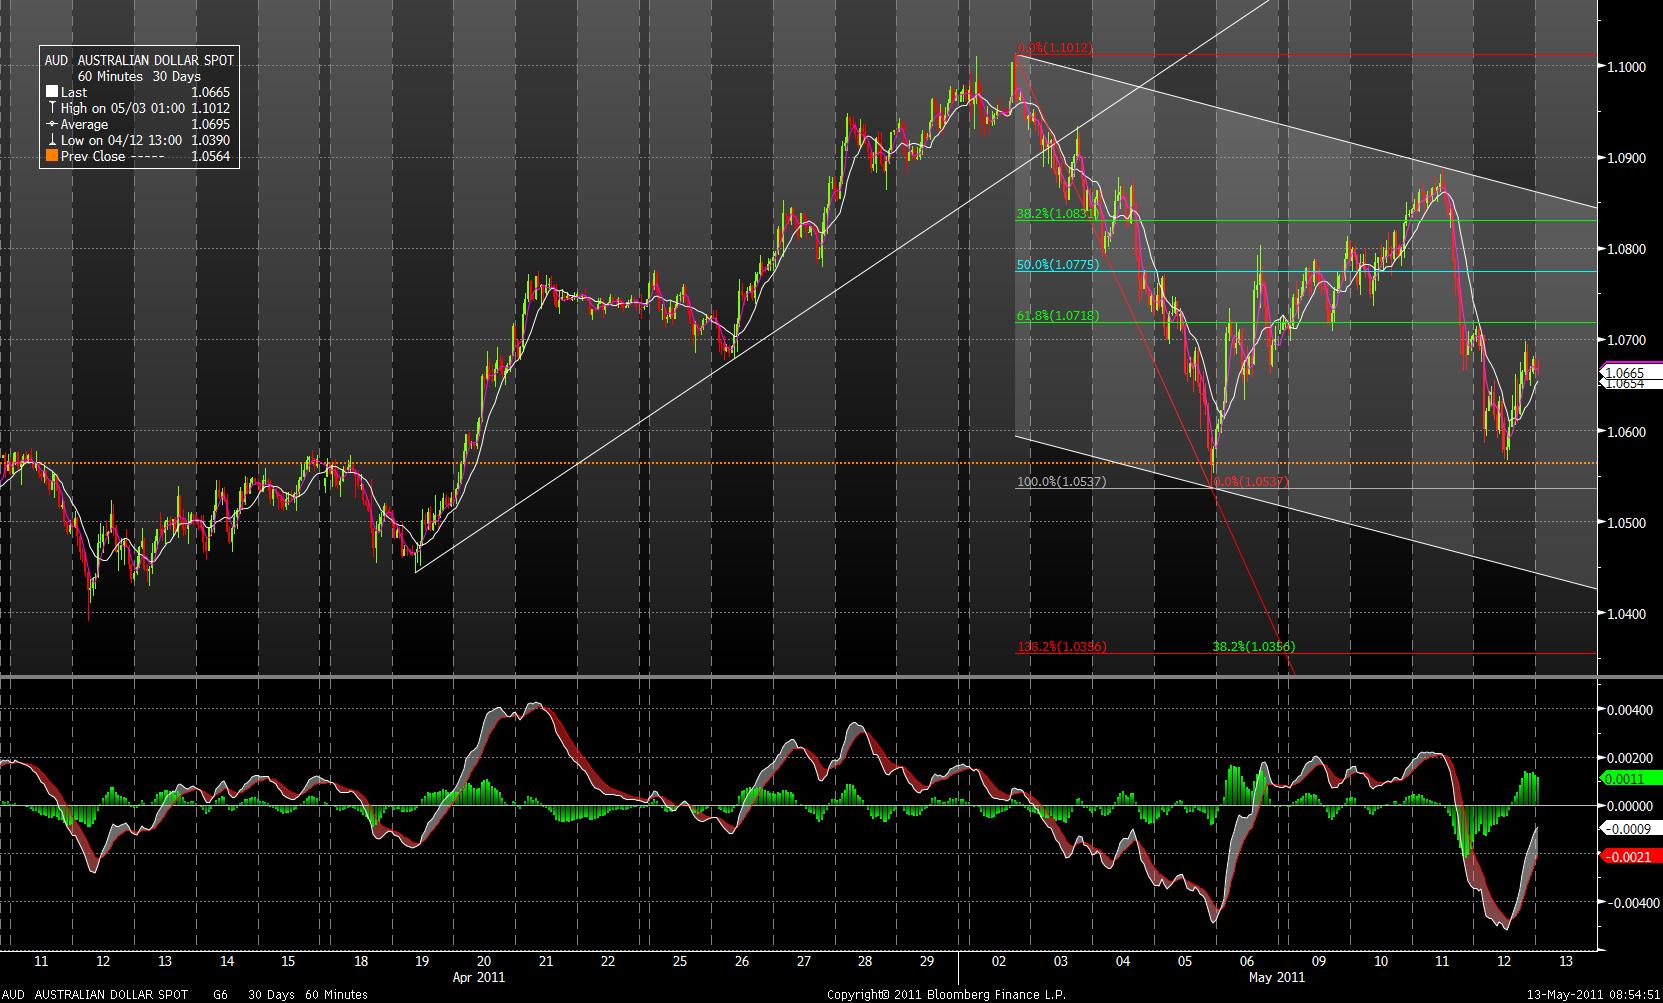
What is clear form this chart is the broad uptrend has been replaced by the last weeks’ even more broad downtrend. What is evident in this chart is that the average range per hour has also spiked. The Aussie currently has an average true range of 35 pips from a high just under 50 pips last week but just 25 pips for most of the previous month. These small pips might only sound tiny but they are important because when volatility rises conviction to trades normally drops and so you get a self reinforcing volatility loop.
It’s consistent with the struggle between bulls and bears.
What the chart tells us on the hourlies is that the zone between last week’s low at 1.0537 and last night’s low of 1.0570 is key short term support. Top side resistance is falling with the trend and sits at 1.0690-1.0766 which is the 38.2%-61.8% Fibonacci region. Above that 1.0865 is the top of the downtrend as I write.
Lets have a look at the daily chart and see what that adds.
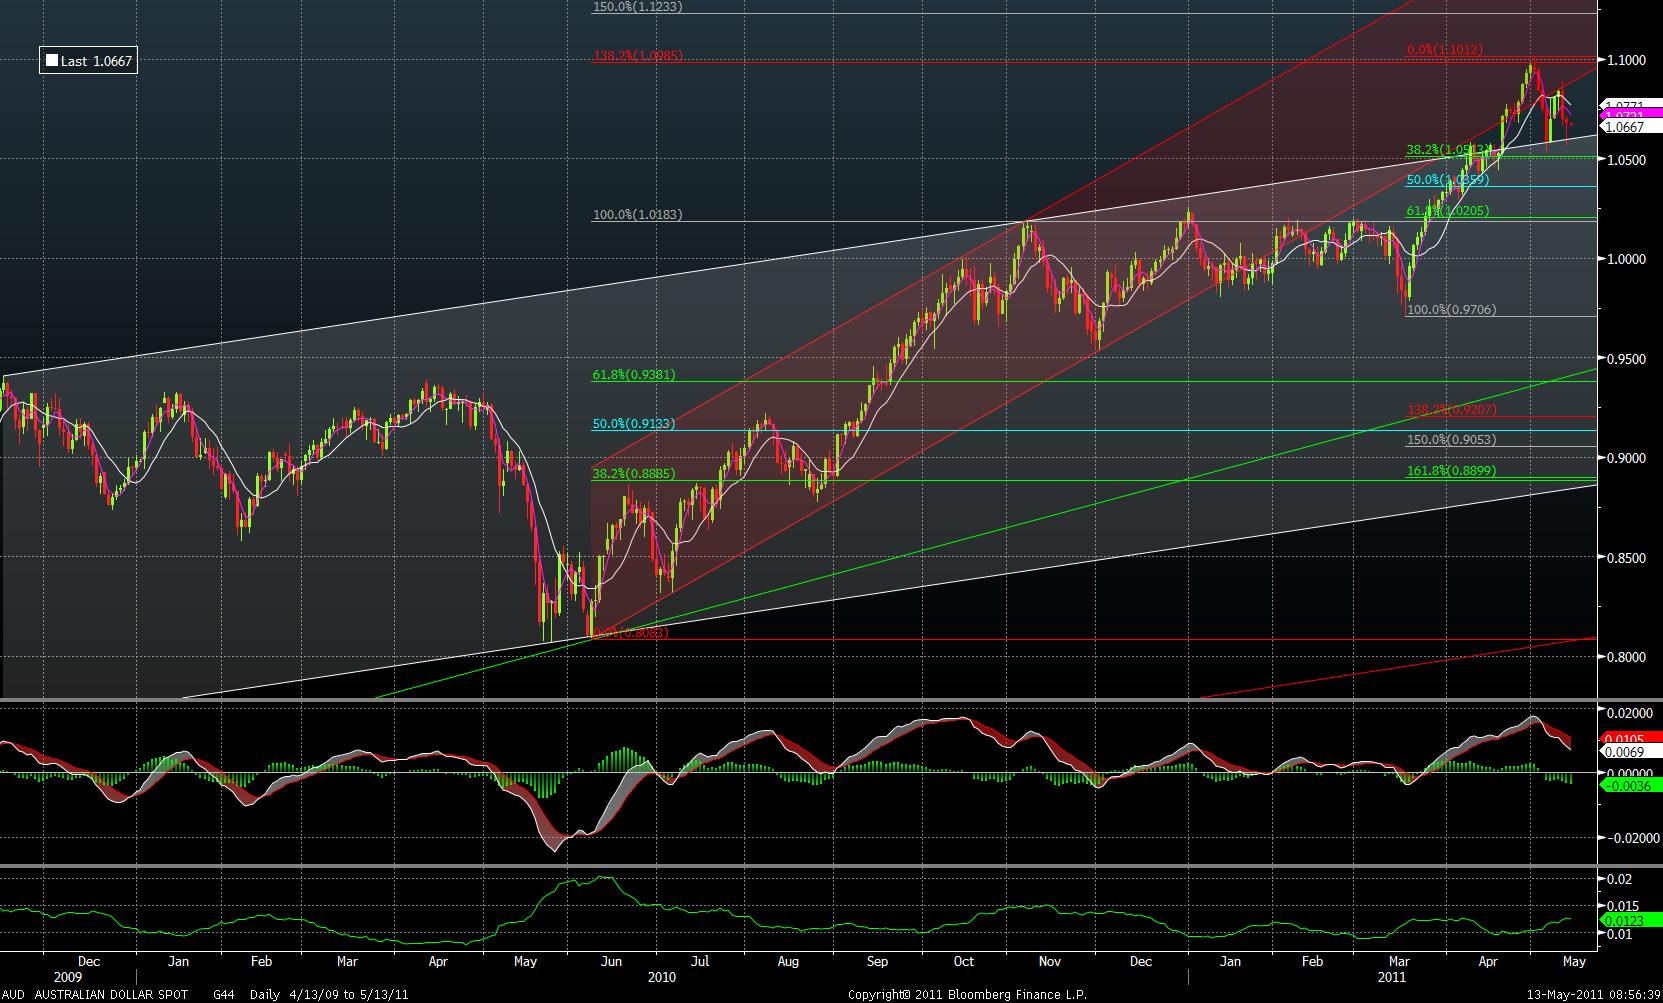
You’ll need to click on the chart to blow it up and get a good feel for it but we can see that the top of the old uptrend that goes back to 2009 is currently supporting the Aussie on a close basis. Why old trendlines work like this is hard to fathom b ut almost 25 years of doing this has taught me that often they do – so I don’t question it, just observe.
More importantly is the 38.2% retracement level of the March to May move which took the Aussie from .9706 to 1.1013. this level at 1.0513 reinfoces this low 1.05 region as key support for the Aussie both in the hourlies and on the dailies. A push through here signals a move to next support at 1.0359 and 1.0205.
Once again I’d highlight the increase in the ATR which has risen to a 5 month high at 1.23 cents per hour. As noted above this will lead to smaller positions, less conviction and more volatility.
So what am I trying to say?
For mine the Aussie’s medium term top looks like it is in place at 1.1013. But in order for the downside move to accelerate we need the Aussie to close below 1.06 and trade below 1.05. If that happens then we could see a much bigger retracement than the market is expecting.
In the meantime it’s a traders market so be careful.
Disclaimer: This post is not advice or a recommendation to buy or sell. We have not taken your specific circumstances into account. Do your own research and consult an adviser before allocating capital or undertaking hedges.