The report argues that the exponential growth of real estate and infrastructure spending in China is unsustainable and a painful adjustment will occur sooner or later, although SocGen acknowledges that it is impossible to predict when the slowdown or correction will occur.
Below are some of the key extracts and charts from the SocGen report.
Advertisement
We believe that the exuberance of the Chinese construction market is obvious. Various data, such as cement consumption and the number of sqm built within a year, indicate that China is running ahead of its development curve. Thus, Chinese construction needs to slow down to avoid a larger construction bubble with many underperforming projects. However, as we have seen with the 12th five-year plan, the central government is unlikely to promote such a policy as construction remains the easiest way to achieve its internal GDP growth targets and to reduce the risk of political unrest among the population. We thus face difficulties in determining the external trigger point that will lead to a slowdown or correction in Chinese construction activity…
China is undoubtedly a capex-led economy. Investments represented 46% of the country’s GDP in 2009 while private consumption was only 36% of GDP… Such reliance on investment is unprecedented among larger nations and all countries that have experienced a significant investment boom since WW2 have all gone through a recession sooner or later.
While we understand that this high share of investment is allowing China to catch up with other developed countries, the length and magnitude of China’s boom gives cause for concern. The key issue with such an enormous investment boom is the diminishing efficiency of investments…
Construction – A key component of China’s GDP growth:
In 2010, we estimate China spent more than $1,000bn on construction (including residential /non residential real estate and infrastructure), representing around 20% of its nominal GDP, or almost twice the world average as the left-hand chart shows. Construction spending in China grew at an outstanding rate of 17% per annum over the last 20 years, rising from $50bn in 1990 to around $1,100bn…
A major driving force behind the surge in construction spending in China was the sharp increase in the country’s urbanisation rate over the past two decades…
Real estate – Long-term demand is there but how to sustain current development rates?
Soaring house prices in Chinese cities have driven widespread concerns over the emergence of a large property bubble that could burst any time. The pace of Chinese real estate construction is unprecedented, raising questions about the balance between supply and demand for housing. Real estate investment growth averaged 25% over the past eight years and growth even increased to 34% in Q1 2011.
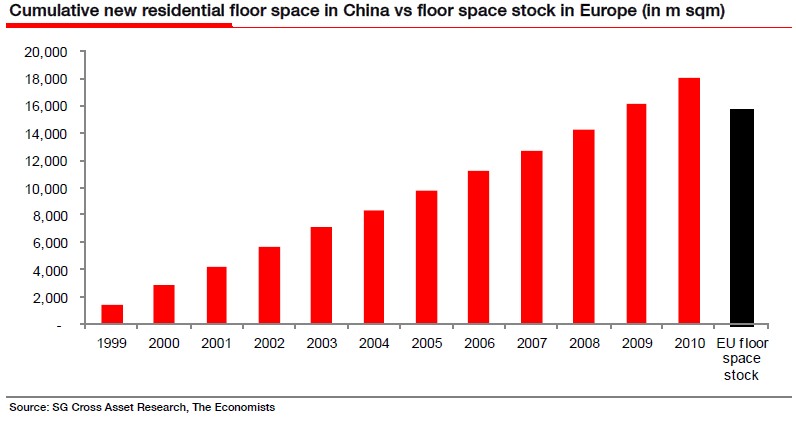
Rome was not built in a day but in China it takes less than two weeks!
China has built the entire European housing floor space stock (limited to Czech Republic, Sweden, Portugal, Greece, Poland, Netherlands, Spain, UK, Italy, France and Germany) in less than 10 years. Within 10 years, China has built slightly more than 16 billion sqm of completed residential floor space, enough to provide accommodation for 600 million people assuming 30 sqm per capita. Over the same period, the urban population increased by just 185 million. With around 1.8 billion square metres of new residential floor completed in 2010, China has built the equivalent of Spain’s housing floor space stock. This construction has already provided accommodation for 60 million people while the urban population only increased by c. 20 million. If China were to keep its current construction rate within the next five years, the 9 billion sqm of new housing built would provide accommodation for 300 million more people. China would thus have the available floor space stock to accommodate an urbanisation rate of 65-70%… the IMF’s forecast for 2030!
Although we understand the need for more housing construction as the rural population gradually moves to the cities, we are concerned by its development pace. At the current growth rate and assuming that the average number of people per household remains flat, the residential floor space per head would reach 40 sqm by 2015, above that of the UK or Germany…
Elevators & skyscrapers – Examples of real estate exuberance:
To further highlight the exuberance of the Chinese real estate market, we looked at the elevator industry. Sixty percent of the world’s new elevators go to China. The number of units delivered reached more than 300,000 in 2010 against around 10,000 in 1990, a compound growth rate of nearly 20%. The most surprising data is that, with an installed base of around 1.6 million units, the current delivery rate represents around a 20% increase in the installed base per year. Such an increase in the installed base looks unsustainable in the mid-term.
Real estate analysts often assess the pace of real estate construction by looking at the number of skyscrapers built around the world. Today China can boast nearly half of all skyscrapers due for completion worldwide in the next six years. Currently China has more than 200 skyscrapers (defined as a building over 150 metres tall) under construction, which is equivalent to the total number of skyscrapers in the US. In five years time, China is expected to have 800 skyscrapers. Skyscrapers are often seen as a trophy building yielding low returns and thus can be viewed as evidence of construction exuberance.
Infrastructure – Is there anything left to build?
We conclude that a lot remains to be done…but also that a lot has already been achieved and, as with real estate, China seems to be running ahead of its development curve. The pace of infrastructure building in China has been unprecedented and looks unsustainable in our view…
China has almost 60 metres of paved roads per car while a similar ratio for developed countries stands between 15m and 35m. Obviously, the number of cars in China is expected to increase over-proportionally within the next few years, albeit it is likely to be insufficient to bring China back to international standards.
The Chinese highway network is almost on a par with that of the US despite having four times less cars. Under the 12th five year plan the network is expected to expand by a further 34,000km, which is more or less in line with the 33,000km of roads added under the 11th plan…
A final example of an over-exuberant Chinese construction market can be found in the country’s cement consumption. In 2010, Chinese cement consumption exceeded 1,800 million tonnes, representing around 55% of worldwide consumption…
Per capita, the picture looks even more worrying. Indeed with average consumption of 1,400kg per head, China stands well above the world average ex-China of 300kg…
Spain represents an interesting example for assessing the outlook for Chinese cement consumption. Indeed, Spain had an over-proportional consumption per capita for years before it crashed with the financial crisis and the bursting of its construction bubble. Spanish annual cement consumption peaked at nearly 1,300kg per capita in 2007, ahead of the financial crisis. Four years later, Spanish consumption stands barely at around 500kg per capita, a 60% fall from its peak. Could China follow a similar pattern? Our analysis indicates that such high cement consumption is unsustainable and all countries where cement consumption has exceeded 1,000kg per capita for a number of years have gone through a construction crisis sooner or later.
Leith van Onselen is Chief Economist at the MB Fund and MB Super. He is also a co-founder of MacroBusiness.
Leith has previously worked at the Australian Treasury, Victorian Treasury and Goldman Sachs.


