A new report out today from the Centre for Policy Development shows that Australia’s public service compares favourably with internal peers and is worth a look:
With its Commission of Audit, the Abbott government has made the efficiency of the public service a priority. But nowhere in the terms of reference is any attempt to establish how efficient government activities currently are.
There is a very large difference between seeking to reform a highly inefficient government, where fundamental changes may be required, and reforming a very efficient government and refining existing activities.
Although it is difficult to precisely measure the efficiency of the activities of government, it’s clear Australia’s public sector is among the most efficient in the world. This might seem like a bold claim, but data from respected international organisations make a clear case that Australia performs very well compared to similar nations.
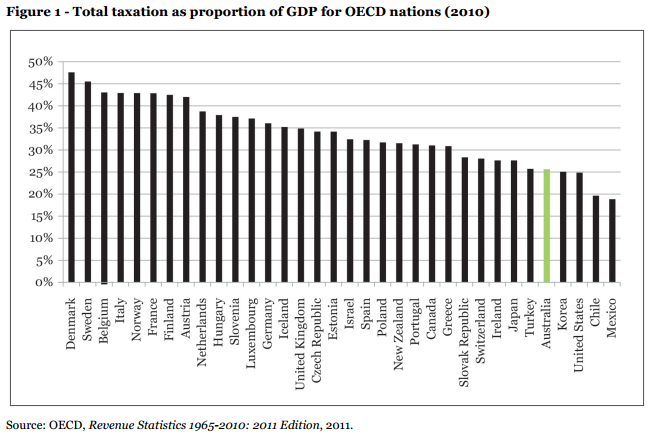
And this should not be a surprise given the kinds of expectations Australians have of their government. We tend to compare ourselves to the high-taxing nations of northern Europe when considering the performance of our public sector in areas such as health and education. And yet our taxation levels are far closer to low-taxing nations such as the United States and Korea. Australians expect northern European services on a US budget, and largely this is what they receive.
While there are some complexities in comparing the amount of revenue different countries gain from taxation, it is possible to get a clear picture of Australia’s relative level of taxation. Contrary to some common perceptions, Australia is a low-tax country. In 2010 we were the fifth lowest-taxing nation out of 34 in the Organisation for Economic Co-operation and Development.
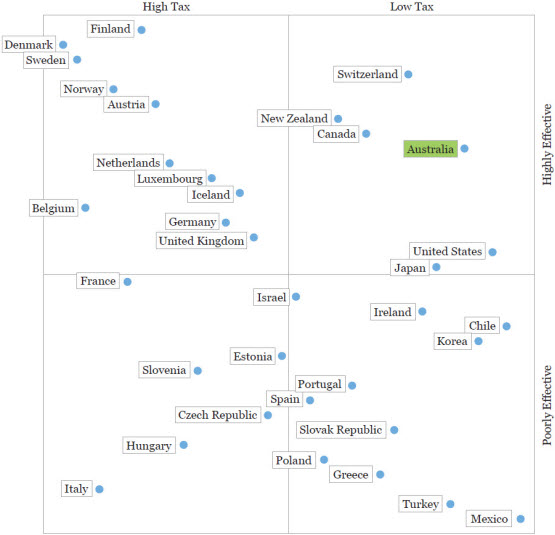
The follow scatter diagram illustrates this by plotting rank in effectiveness against reverse rank in taxation. The nations plotted closest to the top right hand corner are the most efficient …
Source: OECD revenue statistics 1965-2010: 2011 edition, 2011; and World Bank, Worldwide Governance Indicators, 2013
The precise position of different nations on the graph could be debated. The particular methodologies of the measures making up the government effectiveness indicator could be argued over, as could the methodology of the World Bank’s aggregation. Also, superannuation payments are not counted as a tax because they provide personal benefits to the contributor, and it could be argued that this boosts Australia’s apparent efficiency in one area of public services. This means the above graph is indicative, rather than precise.
However, the clear indication it gives is that Australia does well in technical efficiency terms, delivering high outcomes for low inputs.
David Llewellyn-Smith is Chief Strategist at the MB Fund and MB Super. David is the founding publisher and editor of MacroBusiness and was the founding publisher and global economy editor of The Diplomat, the Asia Pacific’s leading geo-politics and economics portal.
He is also a former gold trader and economic commentator at The Sydney Morning Herald, The Age, the ABC and Business Spectator. He is the co-author of The Great Crash of 2008 with Ross Garnaut and was the editor of the second Garnaut Climate Change Review.