
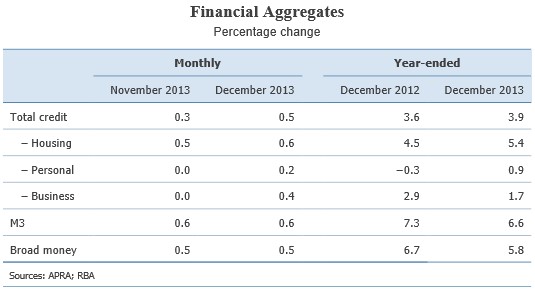
The Reserve Bank of Australia (RBA) today released the private sector credit aggregates data for the month of December:
A chart showing the long-run breakdown in the components is provided below:
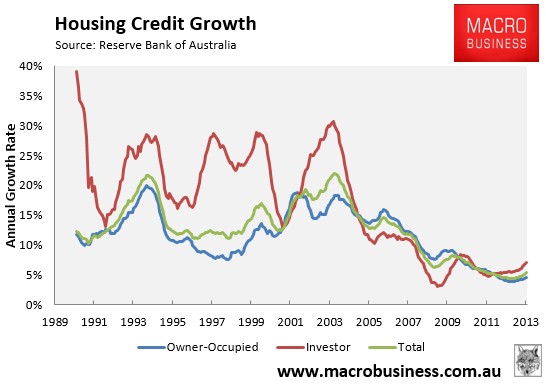
Personal credit growth (0.2% MoM; 0.1% QoQ; 0.9% YoY) and business credit growth (0.4% MoM; 0.5% QoQ; 1.7% YoY) continue to grow at a modest pace, whereas housing credit growth (0.6% MoM; 1.6% QoQ; 5.4% YoY) has been picking-up from, although is remains at fairly subdued levels relative to its long-run average growth rate.
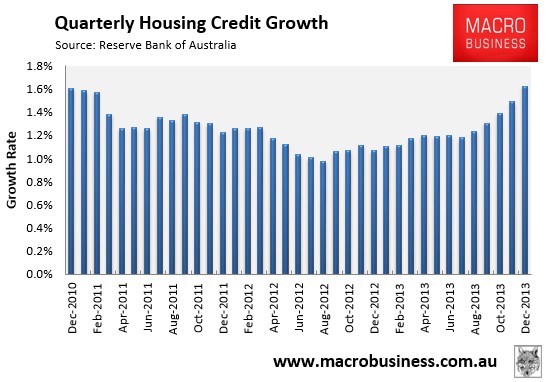
The below chart shows the pick-up in housing credit growth more clearly:
A long-run breakdown of owner-occupied credit (0.5% MoM; 1.35% QoQ; 4.6% YoY) and investor credit (0.8% MoM; 2.2% QoQ; 7.1% YoY) is provided below:
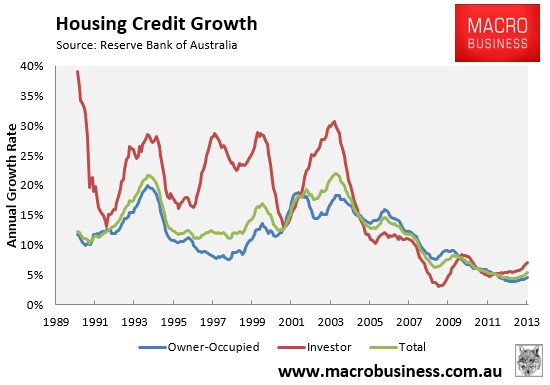
Whereas, the below short-run breakdown shows the situation more clearly:
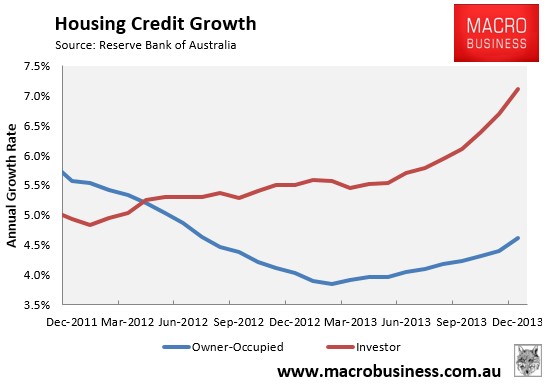
Clearly, much of the current mortgage demand continues to be driven by investors, which has also been reflected in recent housing finance data from the Australian Bureau of Statistics.
unconventionaleconomist@hotmail.com
