By Leith van Onselen
The Australian Bureau of Statistics (ABS) has released housing finance data for the month of April, which registered a 0.1% seasonally-adjusted rise in the number of owner-occupied finance commitments over the month:
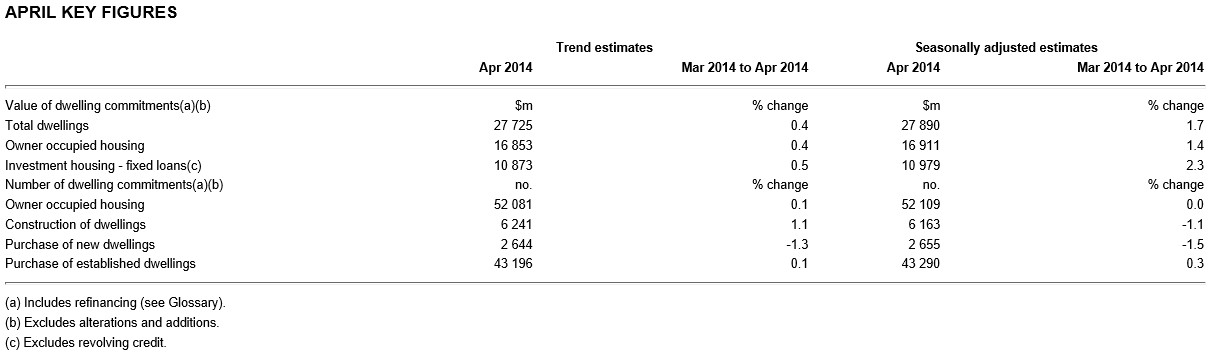
The result was roughly in line with analysts’ expectations, who had expected a 0.2% increase in finance commitments over the month.
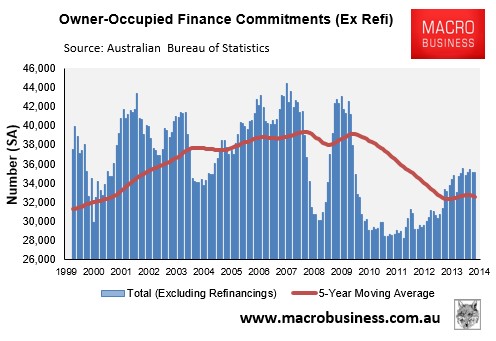
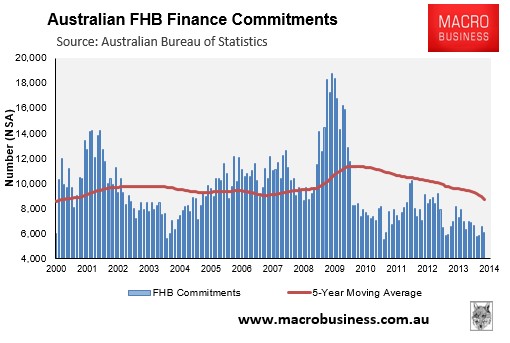
The number of owner-occupied housing finance commitments, excluding refinancings, fell by a seasonally-adjusted 0.3% over the month to be tracking 8% above the five-year moving average level. They were also up by 5.7% on April 2013 (see next chart).
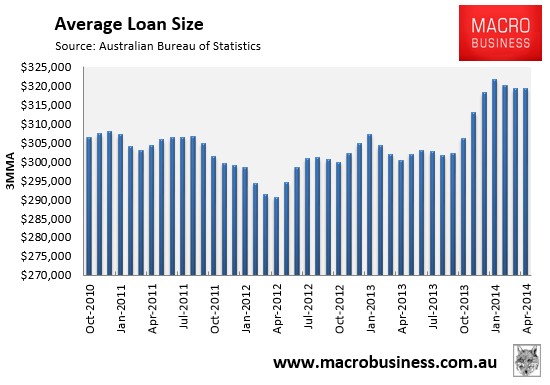
The average loan size rose by 1.3% over the month and was up by 7.2% over the year. The below chart shows the series on a 3-month moving average basis (in order to smooth volatility). Note the recent weakening after spiking in the final quarter of 2013.
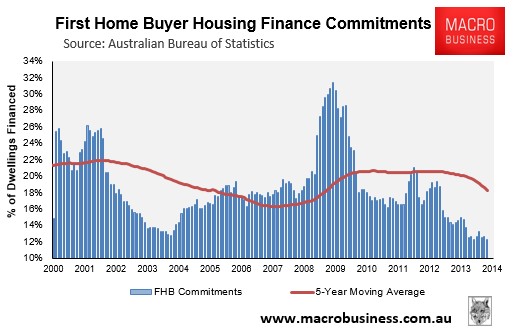
First home buyer (FHB) commitments fell by a non-seasonally adjusted 7.3% in April and represented just 12.3% of total owner-occupied commitments – the equal lowest share on record. The number of commitments were also down 12.7% over the year (see below charts).
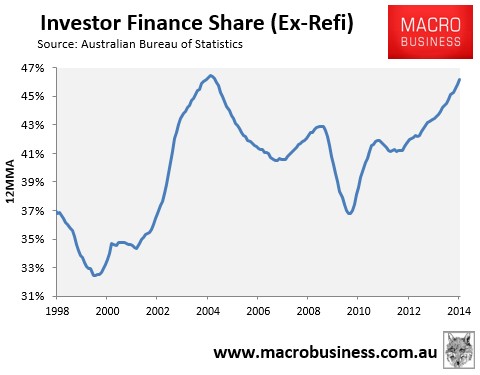
Finally, investor finance commitments rose by 2.3% (seasonally-adjusted) in April to a new record high. They were also up by 30% over the year (see next chart).
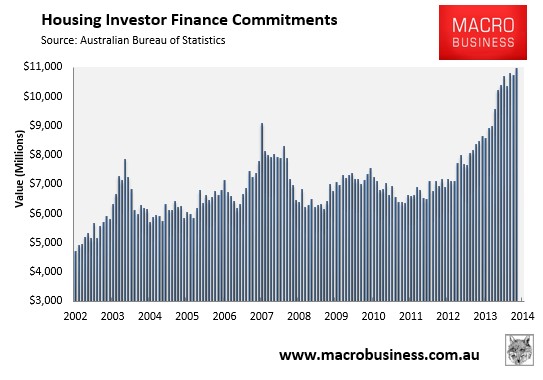
Investors’ share of total mortgages (ex-refinancings) also rose to an equal record high 46% in April, confirming that investors are well and truly the key driving force in the housing market (see next chart).