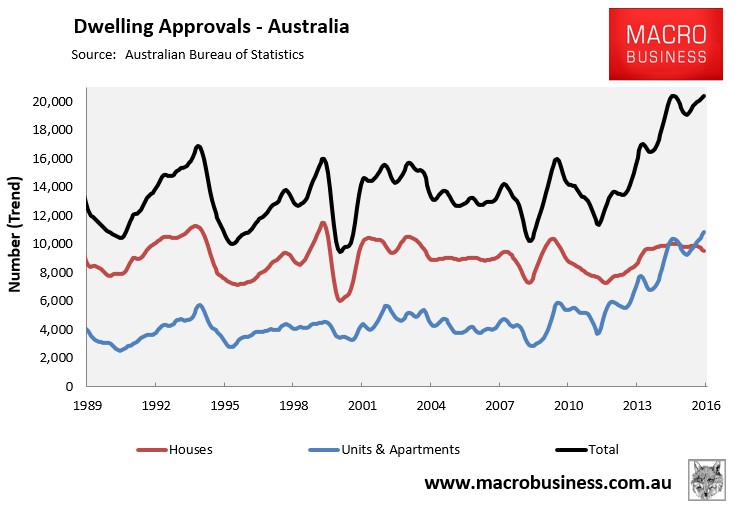
Yesterday’s dwelling approvals data for August from the ABS reported another trend increase in unit & apartment approvals, which have risen by 5.4% over the past quarter in trend terms, hitting another all-time high and easily exceeding detached house approvals (see next chart).
To add more colour to this series, I have once again plotted the breakdown of approvals by type for each of the states and territories, which are presented below in rolling annual terms to smooth volatility.
First, the national breakdown, which shows that detached housing remains the dominant form of approvals, although high-rise (4 or more storeys) has gained significant ground over the past 3-years:
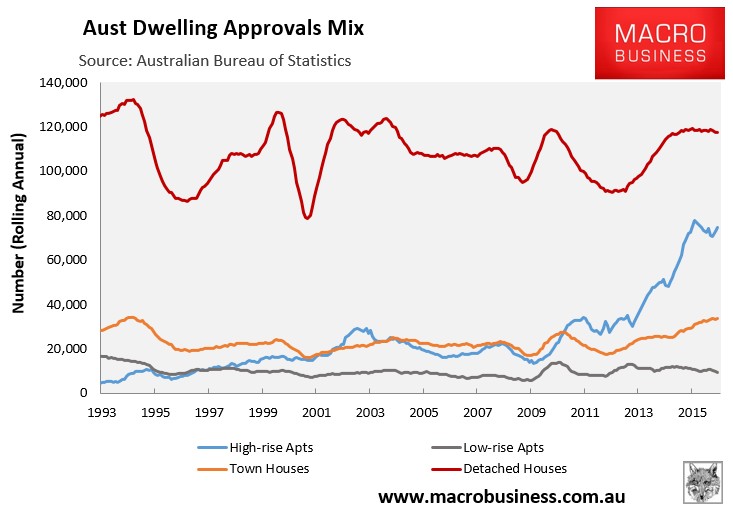
As shown above, there were just under 75,000 high-rise approvals in the year to August, just under the October 2015 peak of just under 78,000.
And now here are the charts at the state and territory level, which shows a mixed bag:
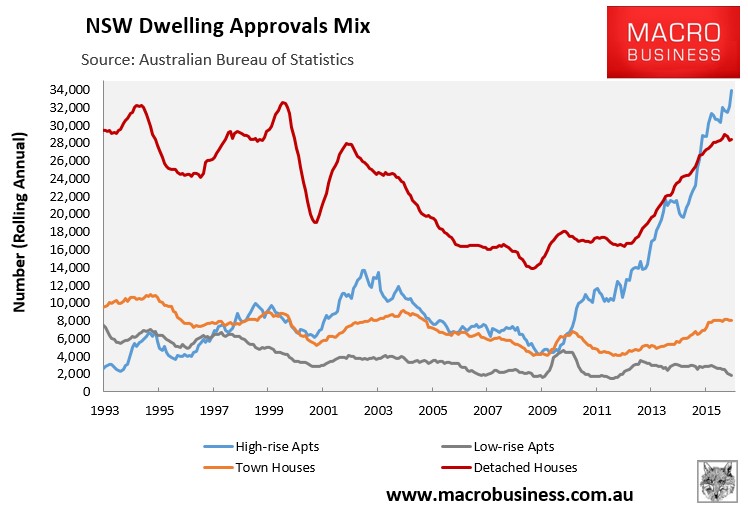
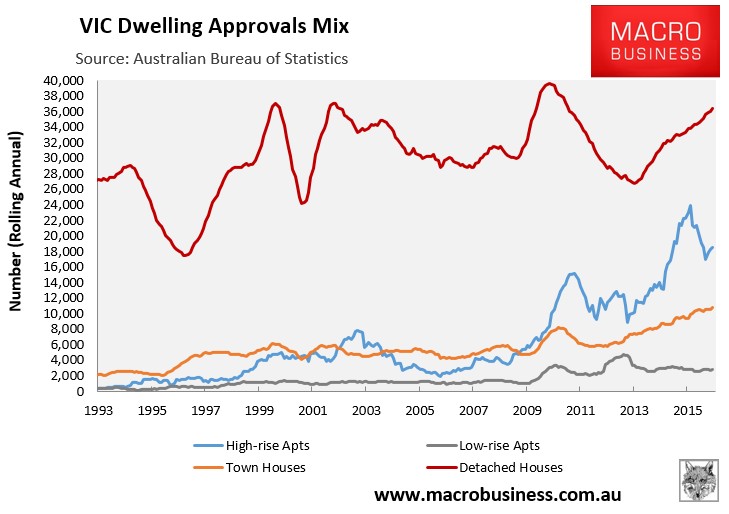
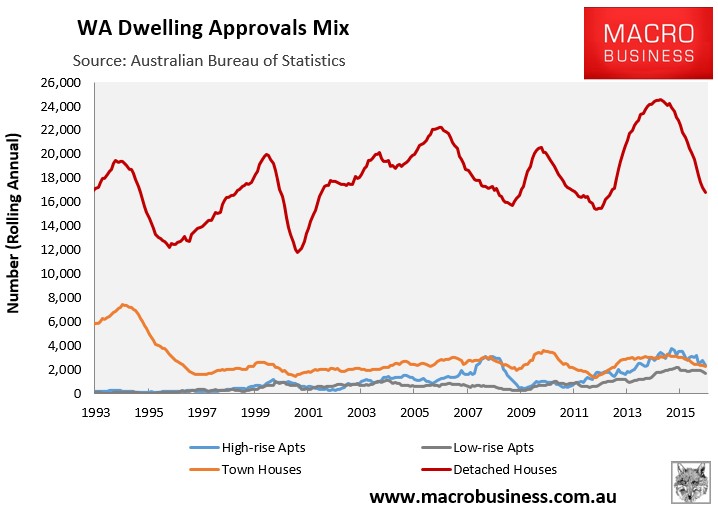
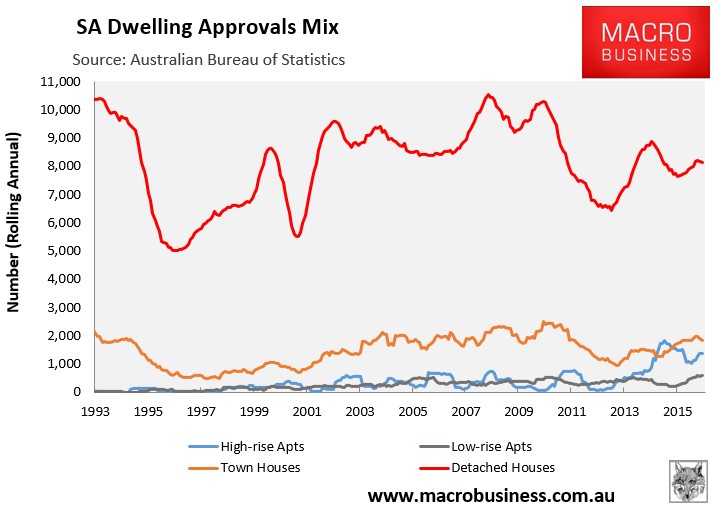
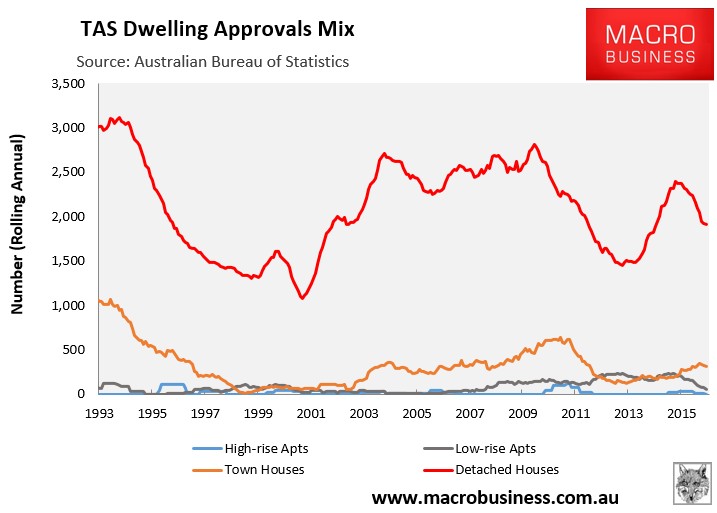
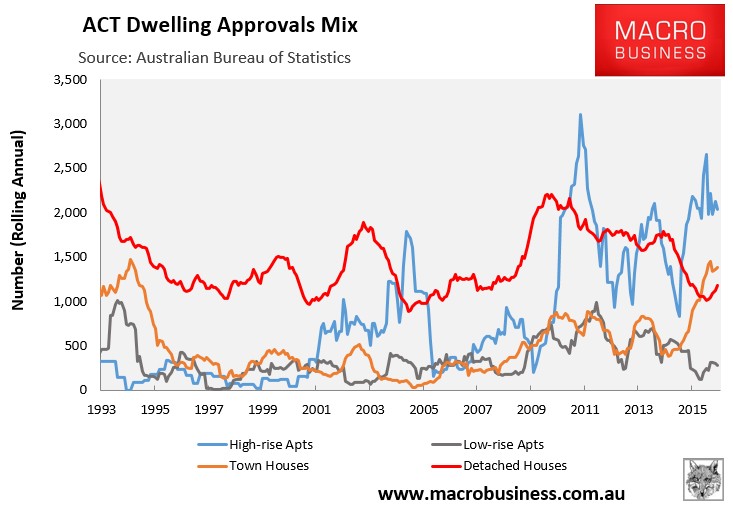
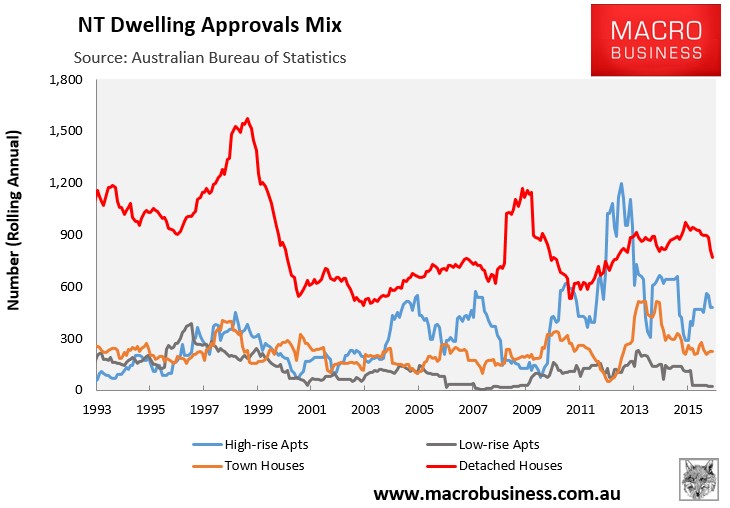
What’s common from the above, at least in the major capitals, is the extent to which highrise apartment approvals have surged, especially across the Eastern states:
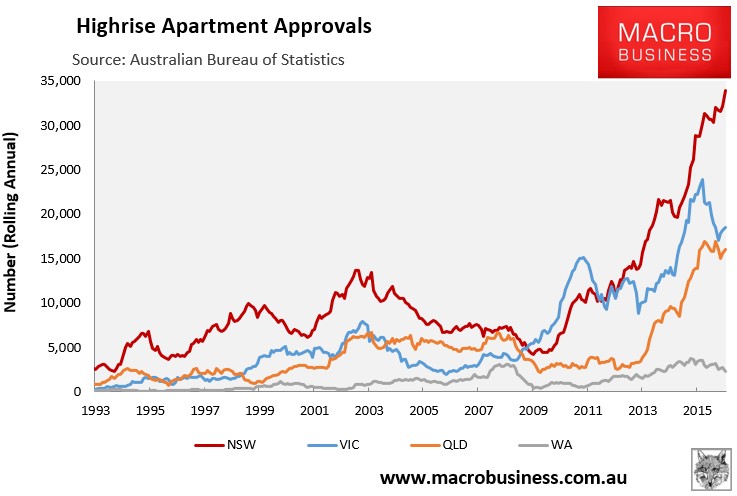
NSW (read Sydney) is experiencing an epic boom in highrise apartment construction, with just under 34,000 apartments approved in the year to August 2016 – an Australian record.
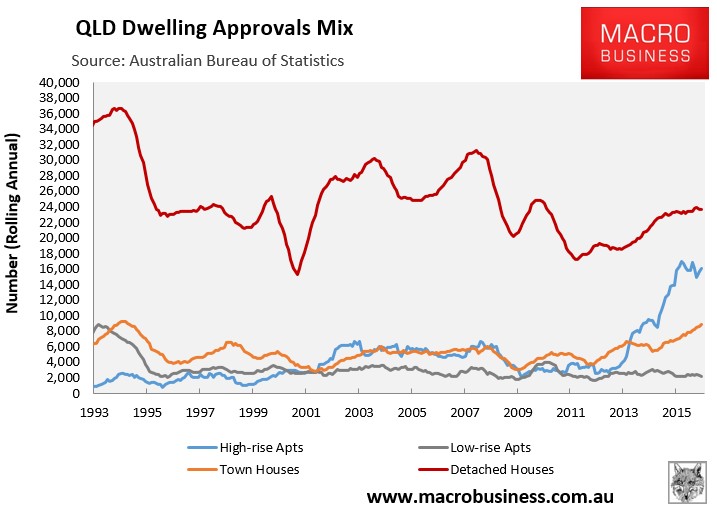
However, detached house construction is relatively far more subdued in NSW – 28,500 versus 36,400 in VIC and 23,700 in QLD – which given its larger population should mitigate any potential apartment oversupply.
Nevertheless, given the unprecedented size and enduring nature of this highrise construction boom, which dwarfs anything else in Australia’s history, the bust – when it eventually arrives (late 2017? 2018?) – is likely to be one for the ages.
At this stage, I still see Brisbane as most exposed, given its falling population growth, followed by Melbourne.