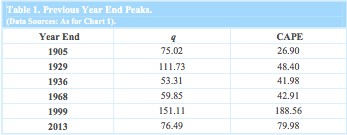
Courtesy of Andrew Smithers via FTAlphaville, a simple table gives you a take on where S&P500 overvaluation currently sits:
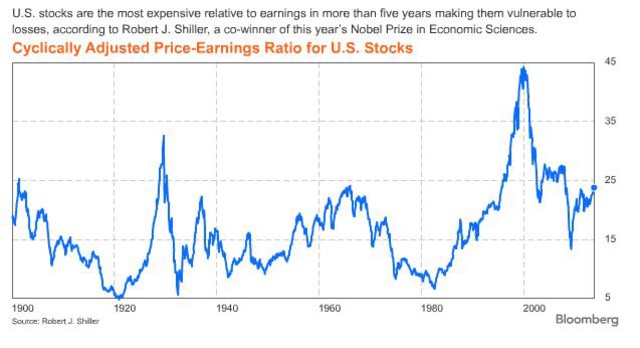
The CAPE measure is described elsewhere by Barry Ritholz:
CAPE looks at the prior 10 years of trailing earnings. It smooths out any given quarters’ ups and downs, and theoretically includes a full business cycle. The way Shiller intended it to be used was to create a valuation metric that would suggest whether stocks are likely to outperform their average returns over the next 10 years.
Advertisement
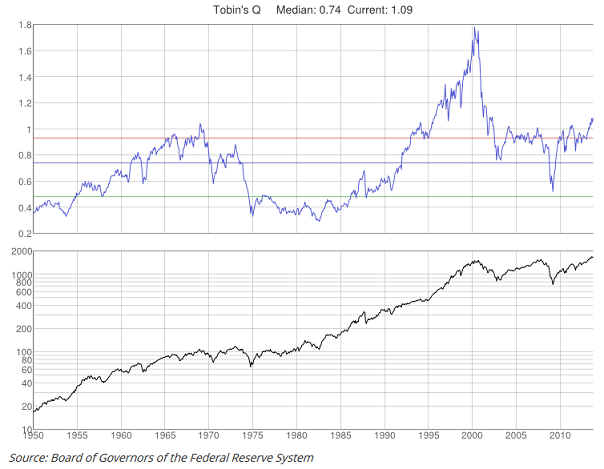
The “q” is ‘Tobin’s q” which is the ratio between the market value and replacement value of the same physical asset. Here it is over the long term:
David Llewellyn-Smith is Chief Strategist at the MB Fund and MB Super. David is the founding publisher and editor of MacroBusiness and was the founding publisher and global economy editor of The Diplomat, the Asia Pacific’s leading geo-politics and economics portal.
He is also a former gold trader and economic commentator at The Sydney Morning Herald, The Age, the ABC and Business Spectator. He is the co-author of The Great Crash of 2008 with Ross Garnaut and was the editor of the second Garnaut Climate Change Review.