By Martin North. Cross Posted from Digital Finance Analytics Blog
In our first post for the new year, we begin a multi-part examination of superannuation, using the recently released data from APRA on industry and fund level performance to June 2013, together with DFA’s own research. Superannuation has become big business, with total assets now worth over $1.62 trillion (compare this with the $5 trillion in residential property in Australia). Last year it grew by 15,7%, or $219.8 billion. So it is important to understand the industry, how funds are performing, and to discover if there are important segmented differences. Note that this excludes the self-managed superannuation sector, which is controlled by the ATO, and runs on a different reporting cycle; and very small funds. These funds rose by 15.5% to be worth $506 billion, representing. SMSFs constitute 31% of the total. We will come back to these later, but today we look at the bigger funds.
To start the analysis, lets look at overall returns across the funds. The average performance to June 2013 was 13.7% in the last 12 months. This is the best result since the GFC in 2007, and ahead of the long term average of around 6%. But this average masks important differences, as shown on the chart below, which is a simple plot of returns ranked from lowest, to highest. This is data from nearly 300 funds, so not all the individual funds are labelled, it is the range of performance, from negative performance, through to over 20% which is interesting. It does make a difference as to which funds your money is in!
We did more detailed analysis of the top 200 funds. Here we show the 1-year data, and the smoother 5-year data by fund, stack ranked from lowest to highest. Again, not all funds are labelled. We see some funds performing much better than others, and some loosing over the 5-year view.
If we take the top 50 funds by size, and plot the performance, we see that size does not seem to matter when it comes to performance. We have included 10-year performance data, though there are some gaps as not all funds are that old. Performance is quite often not sustained across the three time horizons as some funds appear to find it hard to maintain enduring good performance.
Funds are categorised by APRA into Industry Funds, Retail Funds, Public Sector Funds and Corporate Funds. The largest by value are Retail Funds (44%), then Industry Funds (34%).
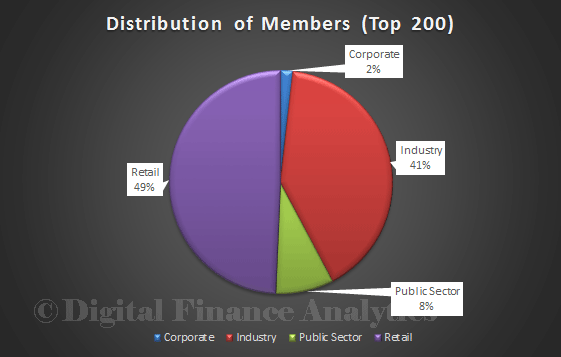
Membership is also spread across the fund types, with 49% in Retail Funds, and 41% in Industry funds.
The average member balance varies by fund type. The average member in an Industry fund has the lowest balance ($27,173) compared with Retail ($30,161), Corporate ($120,273) and the Public Sector ($63,889).
The final picture today, is the relative performance by fund type. Retail funds, whether you look at 1 year, 5 years or 10 years, are under performing. Reasons will include the need for the entity to make returns to shareholders, commissions paid to advisors, different fee structures, and innate process inefficiency.
One last piece of data, there are over 28 million fund members, which means that many people will hold more than one superannuation account. We will come back to the significance of this later.
So, to conclude, we see that Industry funds perform better, that the size of the fund is not correlated to performance in the short or long term, and that there are wider variations in performance across funds, and funds types. All this leads to considerable complexity when individuals are thinking about their superannuation, and later we will use data from our surveys to compare and contrast. But its clear that not all Superannuation Funds are the same, caveat emptor (let the Buyer beware)!


