
Today’s housing finance data, summarised earlier, continues to suggest that investors are crowding-out first home buyers (FHB).
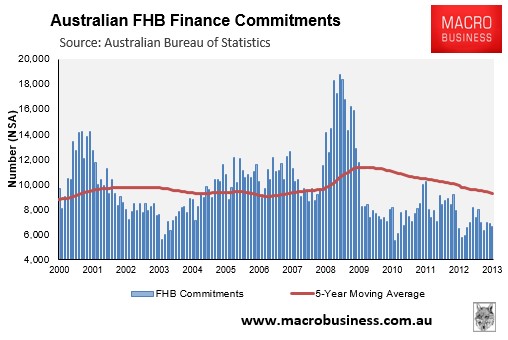
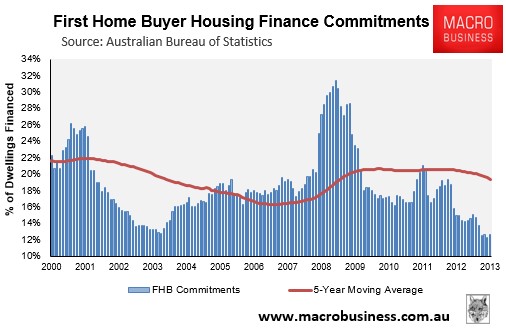
Despite nominal mortgage rates at near multi-decade lows, FHB demand continues to languish, with the number of FHB commitments nationally falling by 1.0% (non-seasonally adjusted) in December and representing just 12.7% of total owner-occupied commitments (see below charts).
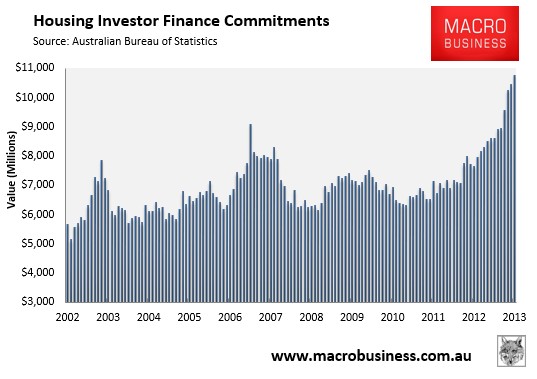
Meanwhile investor finance continues to shoot for the stars, rising by a further 2.9% in December, 41% over the year, and hitting the highest level on record (see next chart).
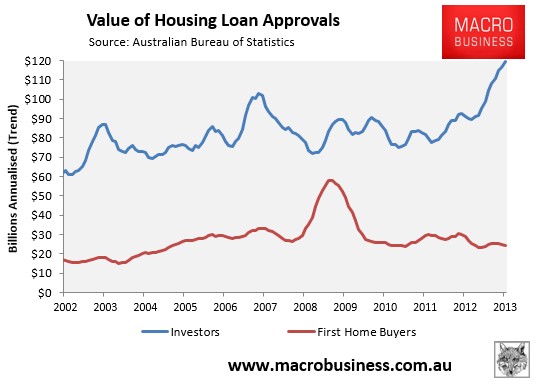
Charting the value of investor finance against FHBs shows the divergence more clearly, with the former powering and the latter remaining in the gutter:
Looking at the state-by-state break-down, you can see that the FHB retreat has been driven by New South Wales and Queensland, where grants on pre-existing dwellings were cancelled in October 2012, as well as Victoria, where commitments have fallen sharply following the removal of FHB subsidies from 1 July 2013 (see below charts).
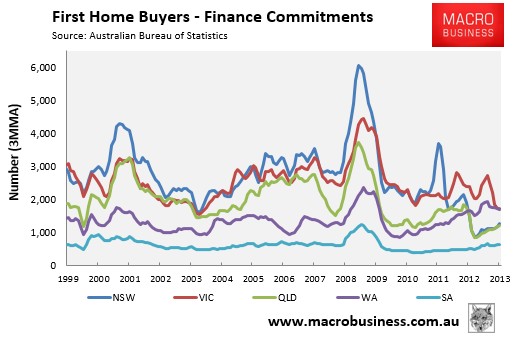
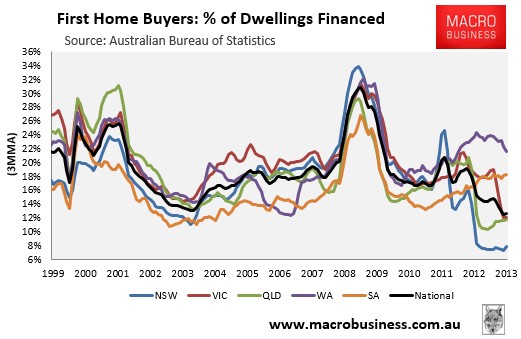
Whereas the FHB share was just 12.7% nationally in November, well below the 5-year moving average (5YMA) of 19.4%, the shares in New South Wales and Queensland were just 8.5% and 12.0% respectively, down from 5YMAs of 18.3% and 17.8%. Meanwhile, Victoria’s FHB share was only 12.2% in November, down from a 5YMA of 20.5%.
A final interesting observation is that the average loan size for FHBs has shown relatively sluggish growth. Since March 2009, the average FHB mortgage has grown by only 7.7%, whereas the average mortgage for the market as a whole grew by 16.0% (see next chart).
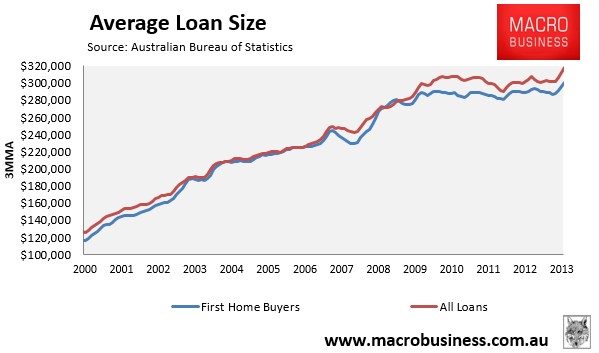
As noted previously, this is undoubtedly an investor driven market.