Today’s housing finance data for January, released by the Australian Bureau of Statistics (ABS), posted a large seasonally adjusted fall in overall housing finance commitments, with the trend in mortgage growth also weakening.
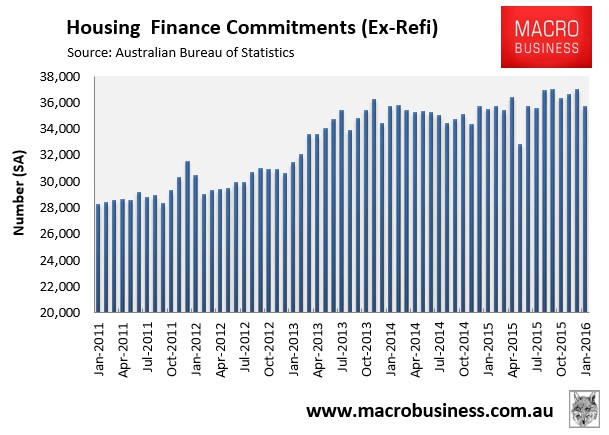
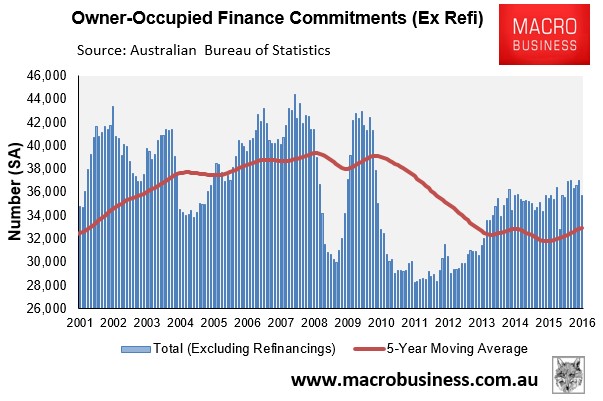
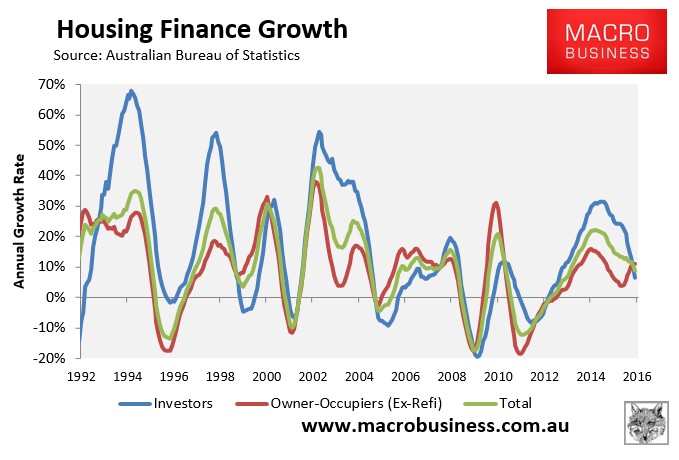
According to the ABS, the total number of owner-occupier finance commitments (excluding refinancings) fell by a seasonally adjusted 3.6% over the month to be up just 0.5% over the year (see below charts).
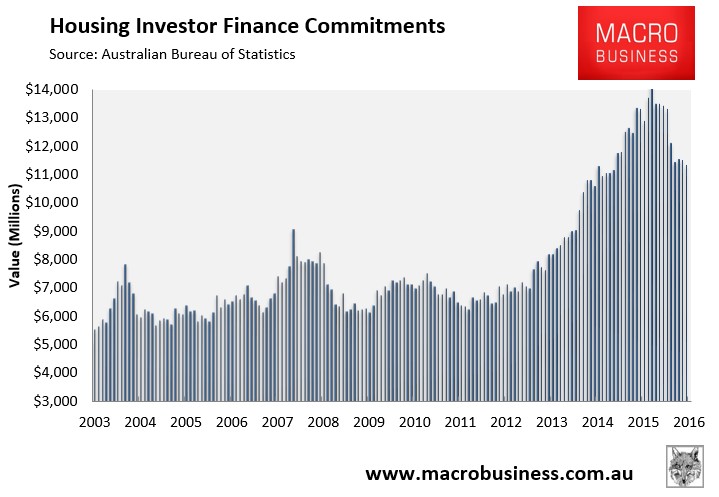
By comparison, the value of investor finance commitments fell by 1.6% in January and were down by 14.8% over the year (see next chart).
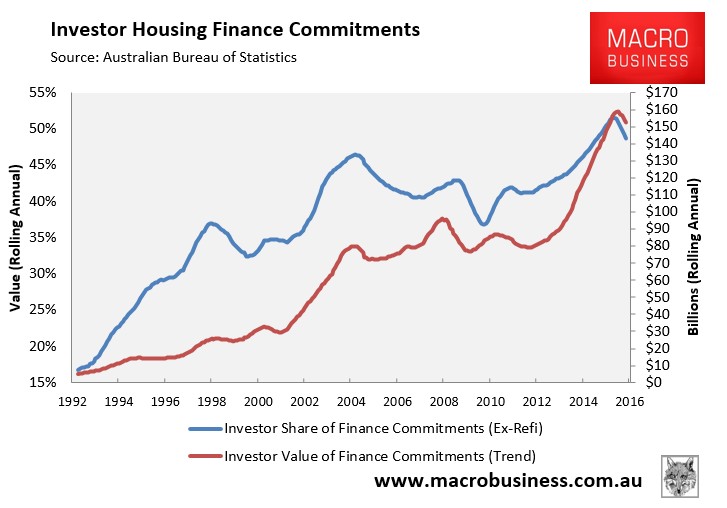
The annual share of total loans going to investors (excluding refinancings) also fell to 48.7% in January from a peak of 51.6% in July:
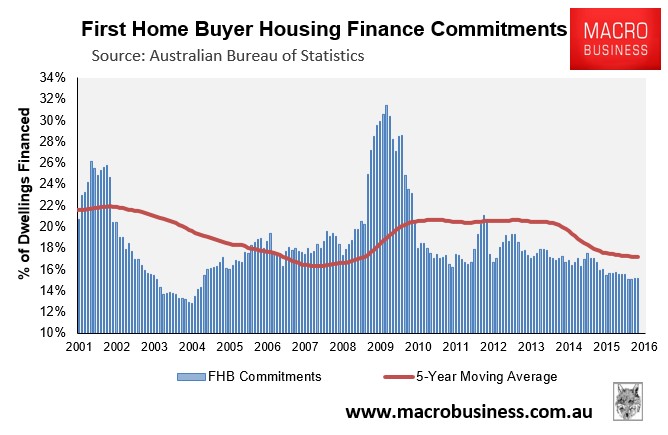
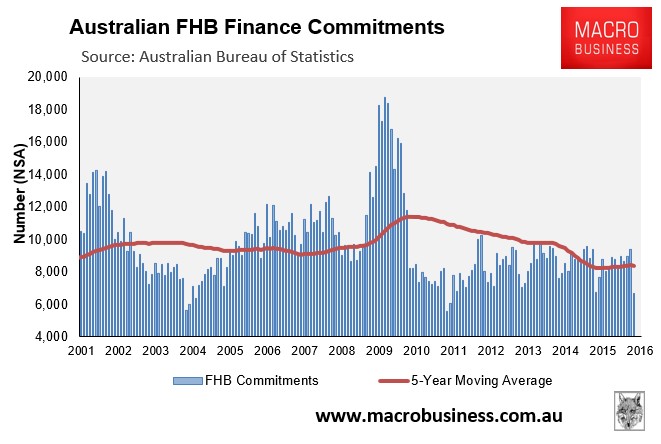
First home buyer (FHB) owner-occupied demand also fell heavily in January (due mostly to seasonality), down by 28.7% over the month and by 1.2% over the year, and represented just 15.1% of total owner-occupied finance commitments (see below charts).
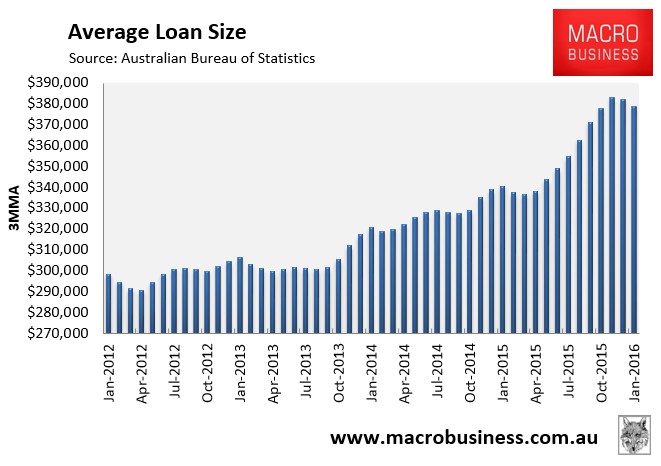
Meanwhile, the average loan size fell by 1.4% in January but was up 9.1% over the year, with the trend falling on a 3-month moving average basis:
Finally, the below chart shows that the trend pick-up in the value of owner-occupied housing demand is only partly offsetting the sharp fall in investor demand:
Based on this data, house prices nationally should be weakening.
unconventionaleconomist@hotmail.com
