A few weeks back, CoreLogic responded to our challenge to justify why its dwelling price series had diverged from the other private data providers – Residex and Domain (APM).
In weighing-up CoreLogic’s response, I noted that we remained skeptical of their index because:
- the index spiked following the methodology change in April, which sent year-on-year growth soaring;
- the daily index experienced massive and unprecedented volatility following the methodology change;
- the break away from the other private data providers; and
- their results seem at odds given the weakening fundamentals of falling housing credit, weaker transaction activity, and rising average selling times, partly offset by stronger auction clearances (albeit on much lower listings).
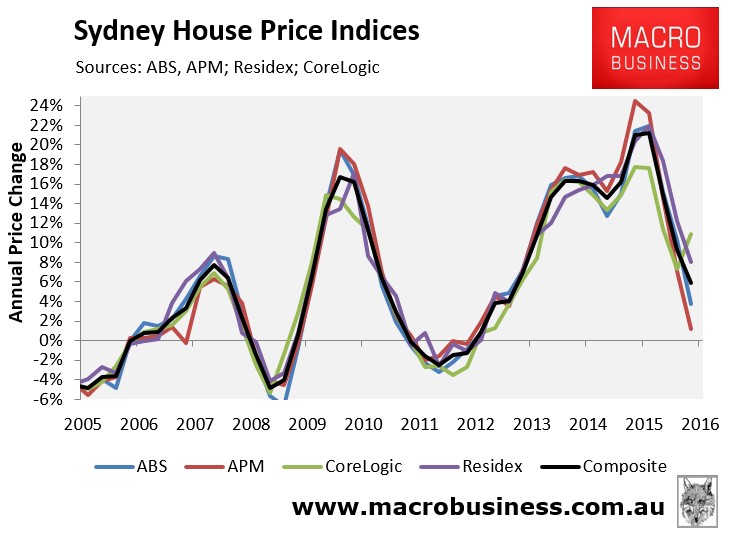
With the release yesterday of the ABS’ dwelling price index for the June quarter, we now have another series to compare CoreLogic’s results to. Below is the national house price picture up to the June quarter:

And here is the situation in Sydney, which is the market most in dispute:
And here are the same charts updated to the latest data (Residex to end-July and CoreLogic to 20 September):
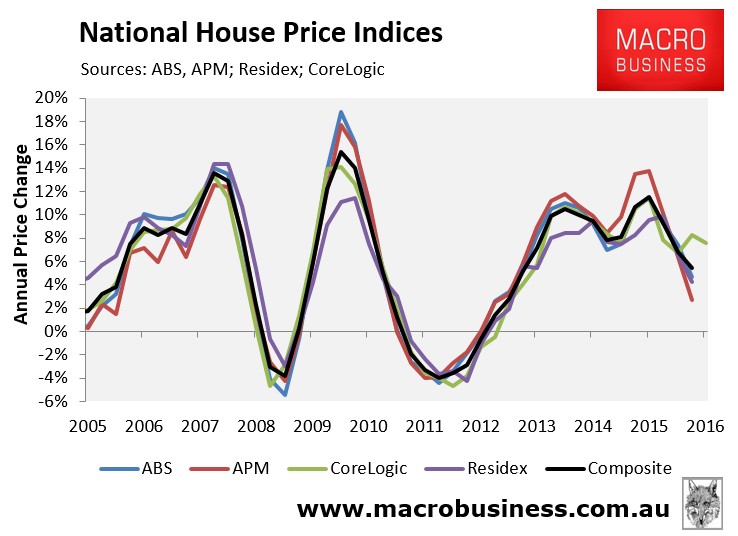
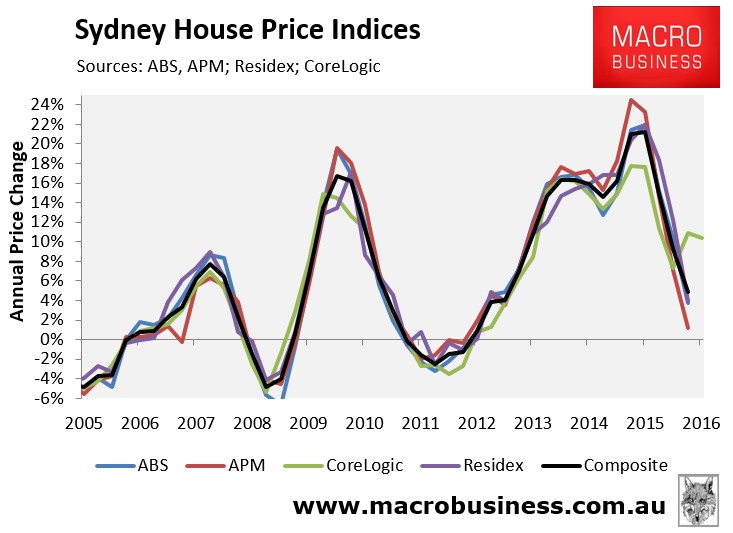
Clearly, CoreLogic is the odd index out.
Ultimately, we won’t be able to gauge the full impact of the methodological change, and the true state of the market, until CoreLogic backward adjusts the daily index to its inception (in March 2011) using the new methodology.
We urge haste.