By Martin North, cross-posted from the Digital Finance Analytics Blog:
We have updated our gross and net rental yield modelling to take account of recent results from our household surveys, which incorporates the latest movements in rental income, investment loan interest rates, and other costs including agency fees and other ongoing costs. This gives a view of the gross rental yield by state, as well as the net rental yield. We also estimate the after mortgage value of the property.
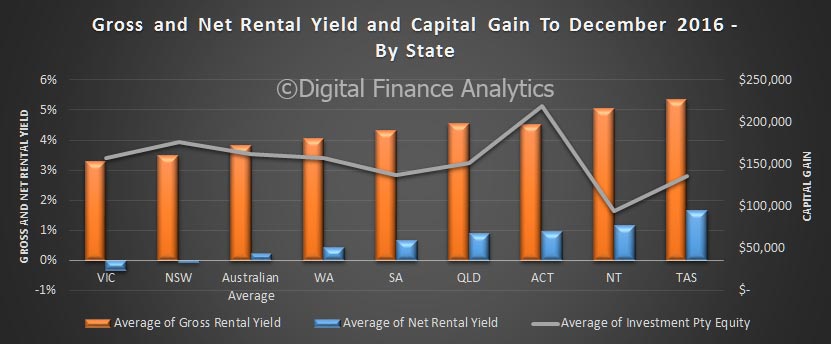
The average rental property has a gross rental yield of 3.83% (down from 3.9% in September 2016), a net rental yield of 0.22% (down from 0.4% in September 2016) and an average equity value (after mortgage) of $161,450 (compared with $161,798 in September 2016).
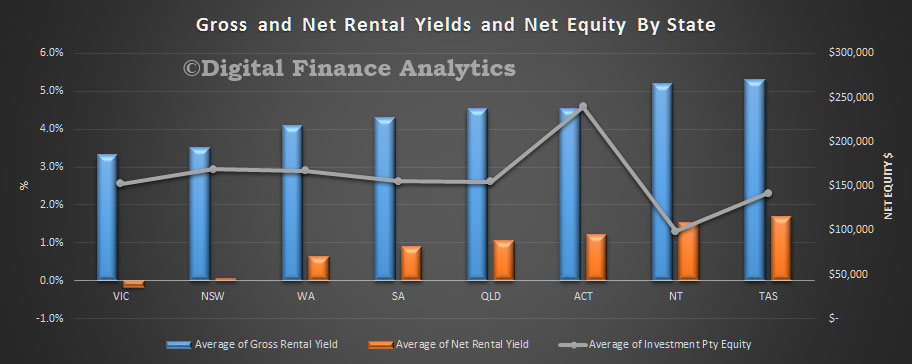
 There are considerable variations across the country with Victoria and New South Wales both under water on a net yield basis. Tasmania offers the best net rental return. We have ignored any potential tax offsets.
We can compare the results from the previous run in September. Of note NSW has now dropped into negative net yield territory.

There are a number of factors in play. These include rising interest rates on investment property, a number of new investment property owners, and a weak rise in rents (which tend to follow incomes more than home prices). Agency management fees, where applicable have also risen.
This means that many investors are reliant on the capital gains providing a return on their investment.
Next time we will look at some of the other data views, by segment, property and location. Many investors, in cash terms are loosing money.

