Iron ore price charts for April 18, 2017:
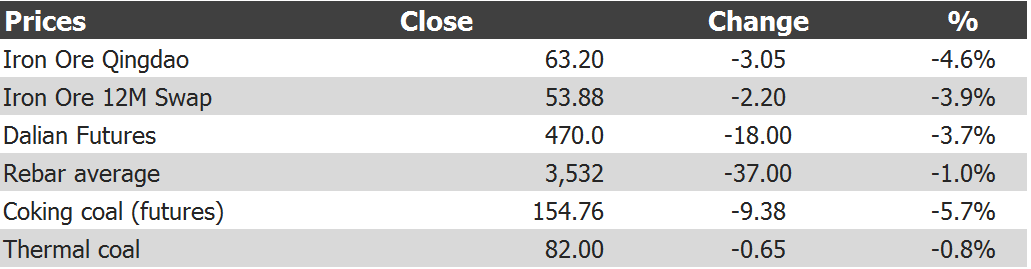
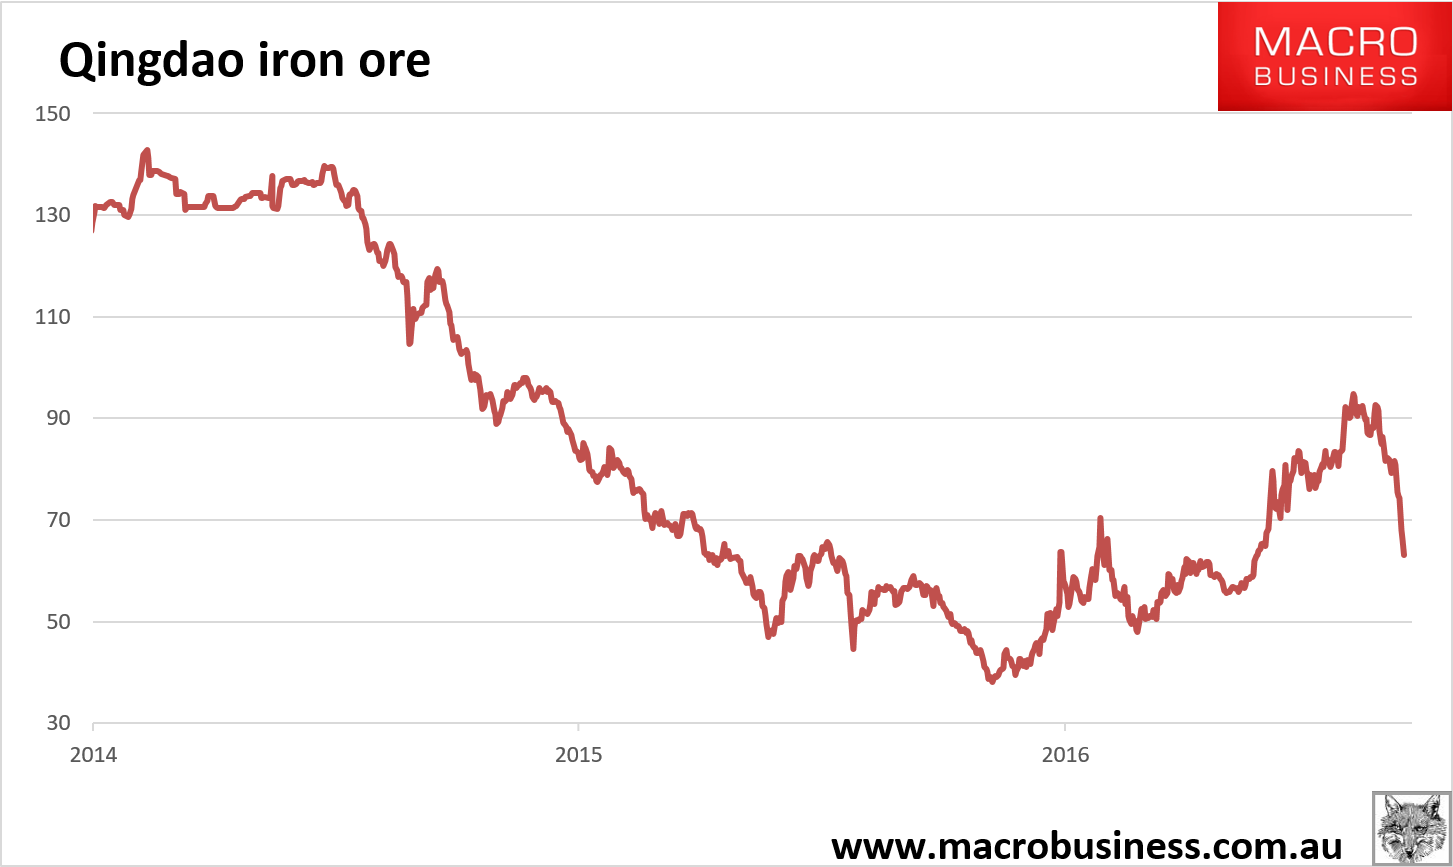
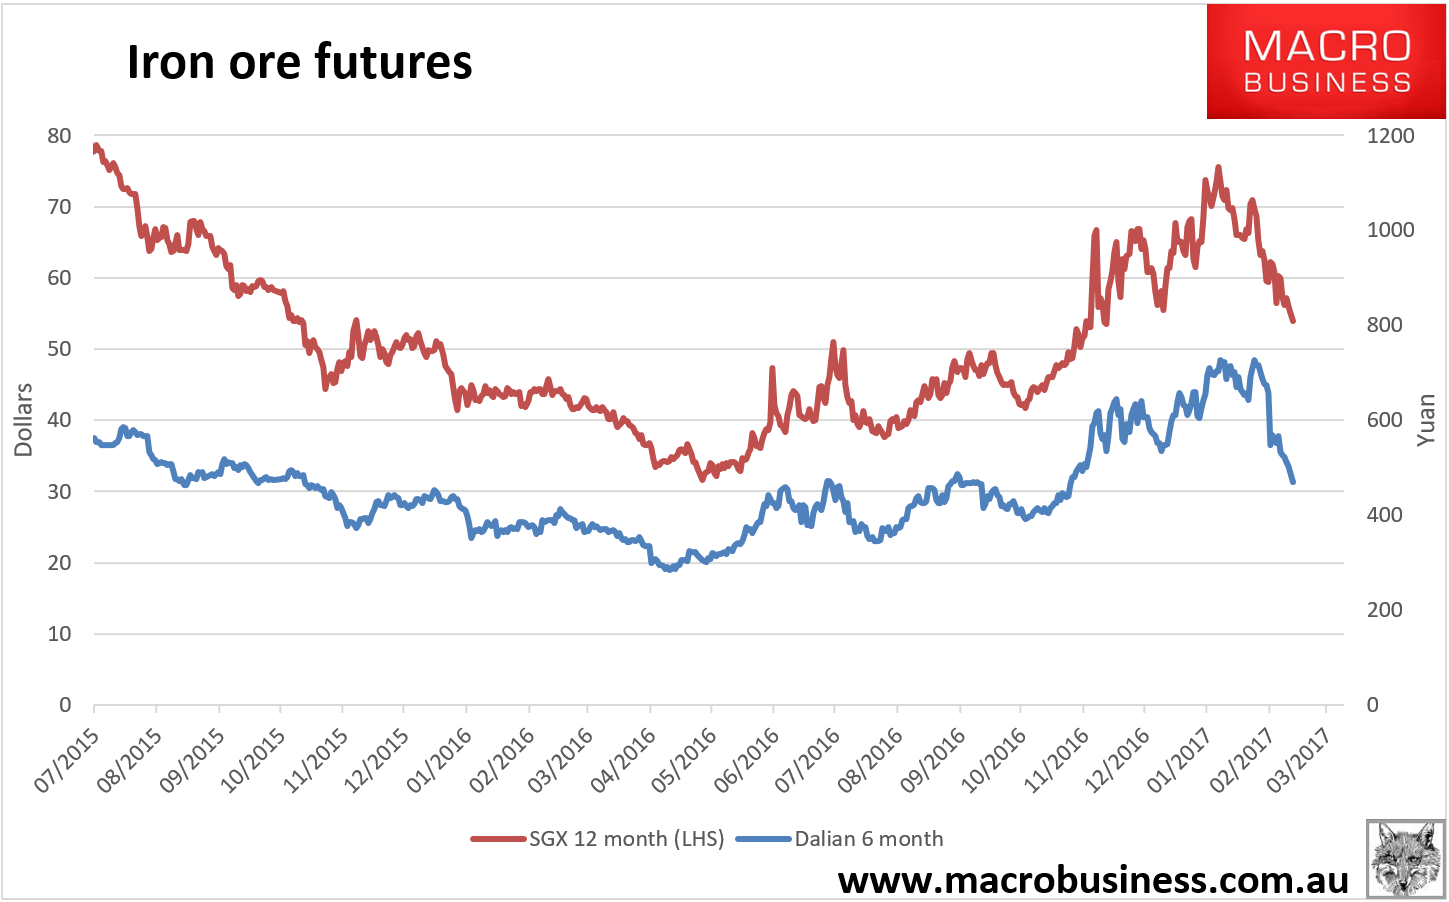
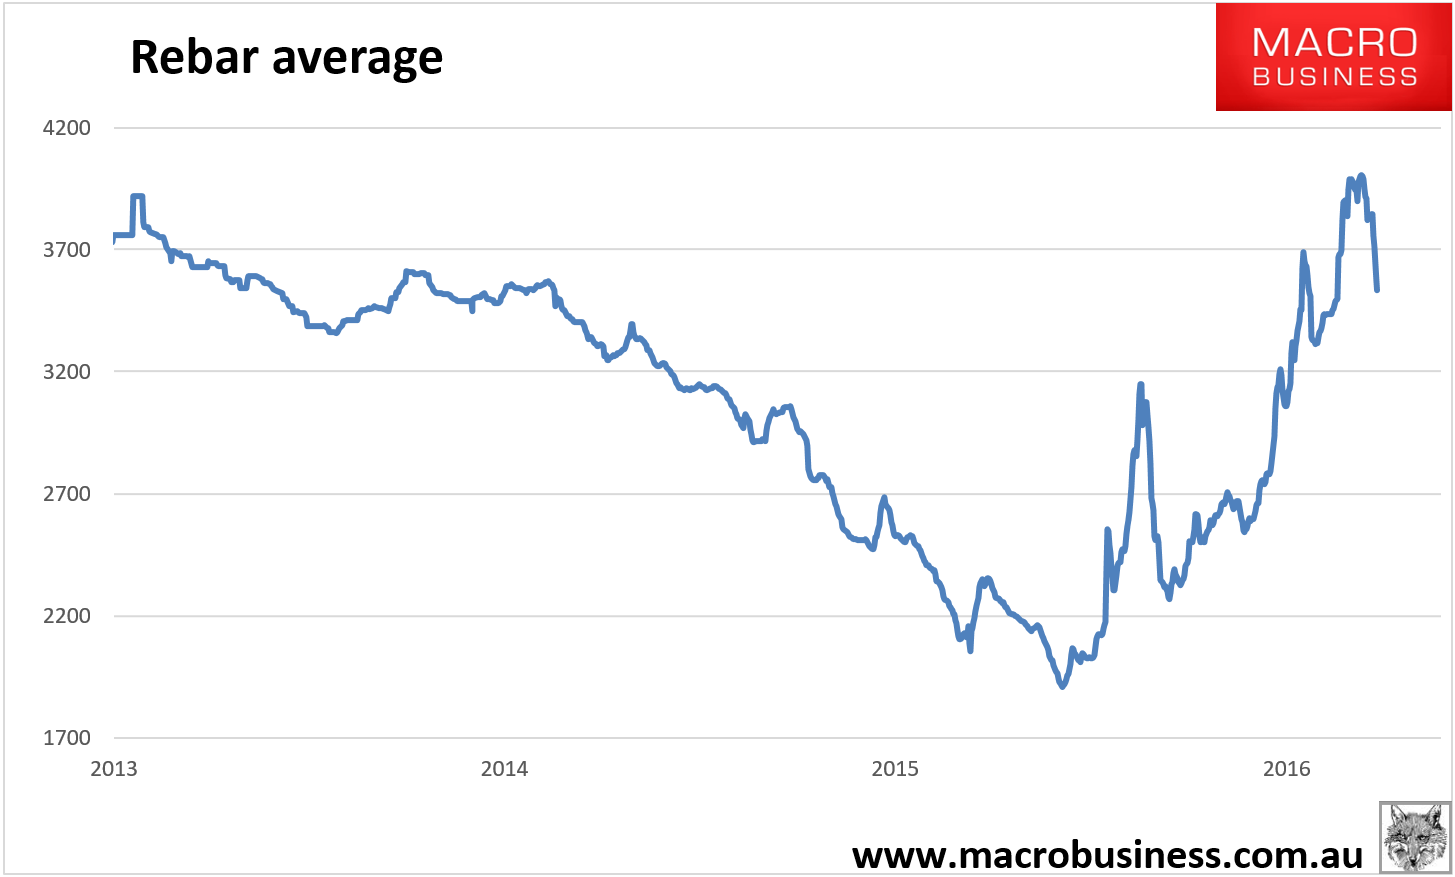
Tianjin benchmark crashed $3.10 to $61.50. Paper is still in free fall. Coking coal futures were put to the sword.
Advertisement
Bloomberg reckons we’re near the bottom:

Iron ore price charts for April 18, 2017:
Tianjin benchmark crashed $3.10 to $61.50. Paper is still in free fall. Coking coal futures were put to the sword.
Bloomberg reckons we’re near the bottom:
The full text of this article is available to MacroBusiness subscribers