Iron ore price charts for February 13, 2018:
Advertisement
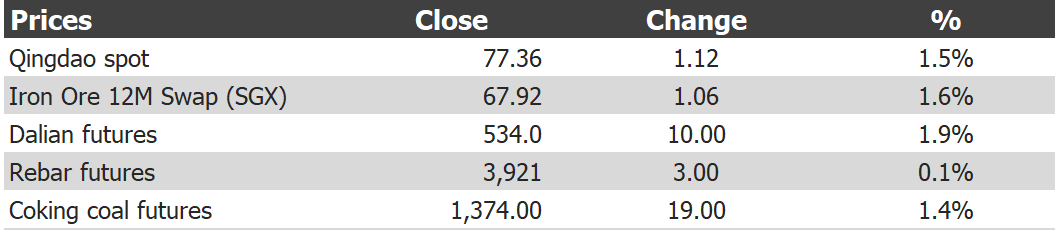
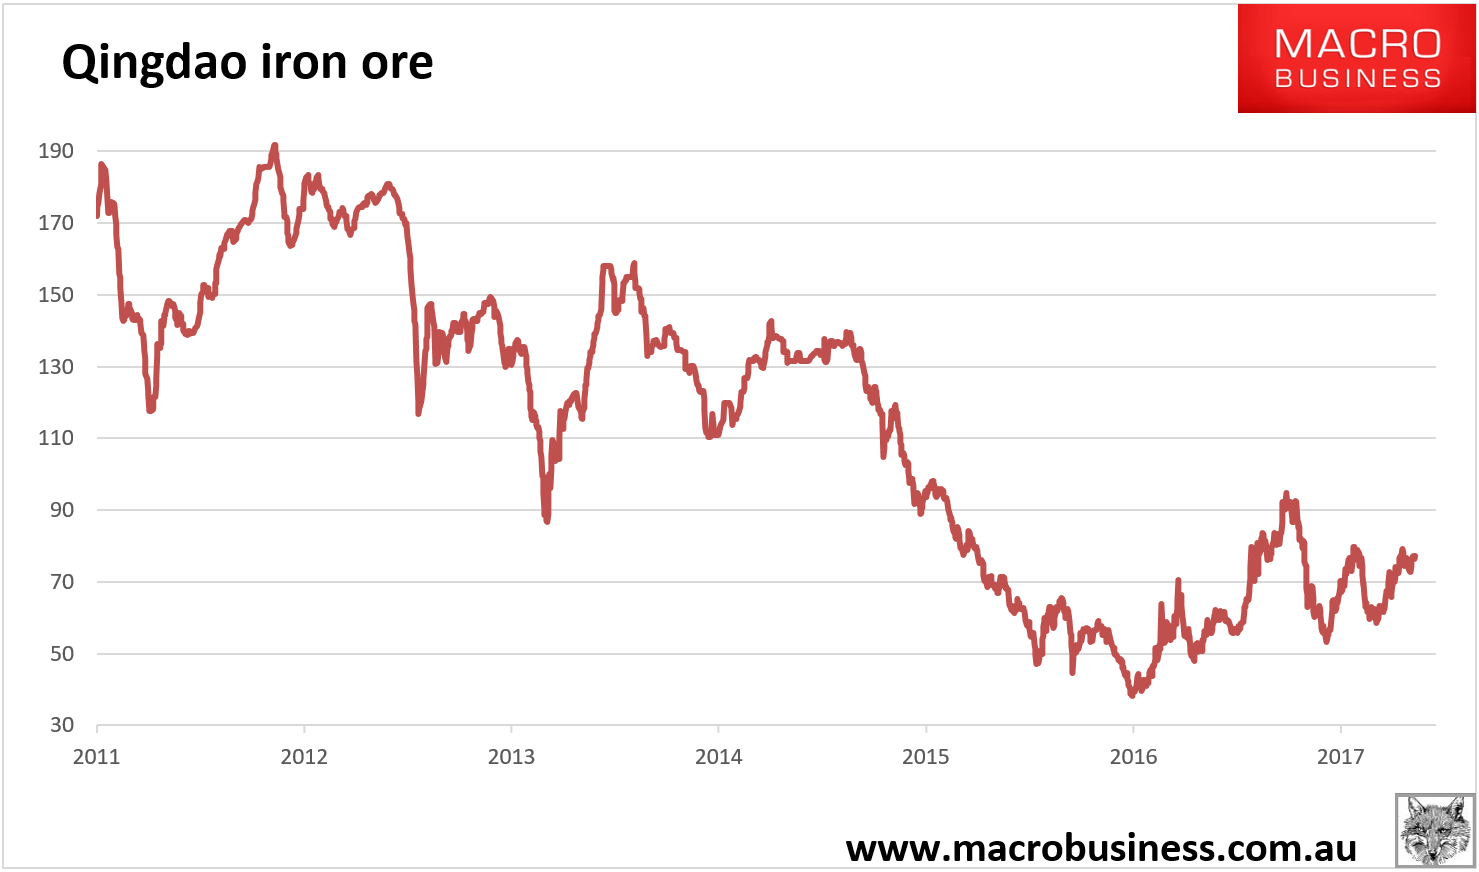
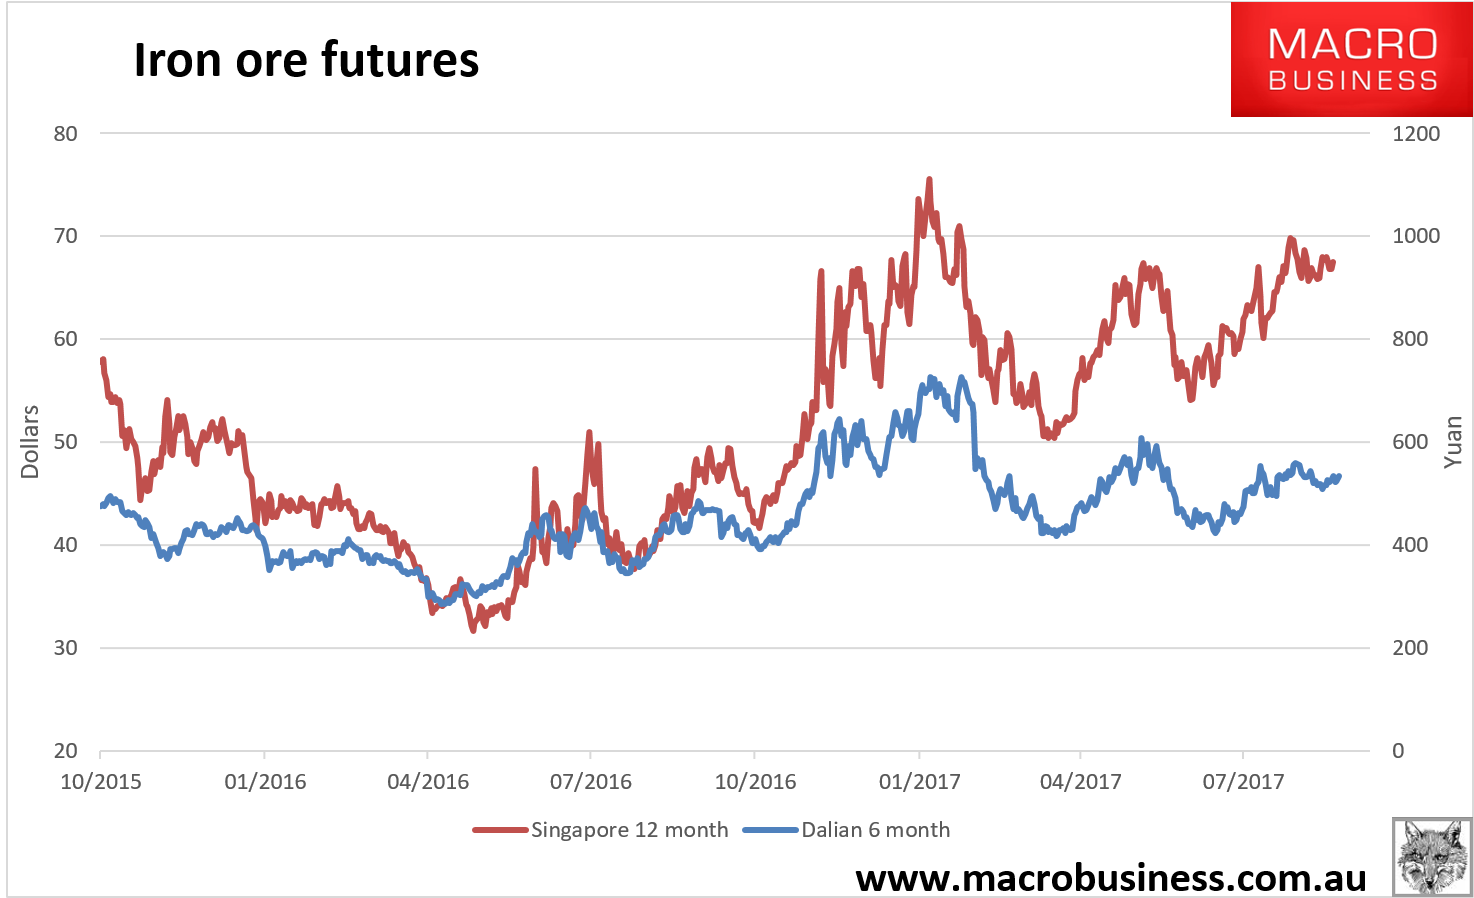
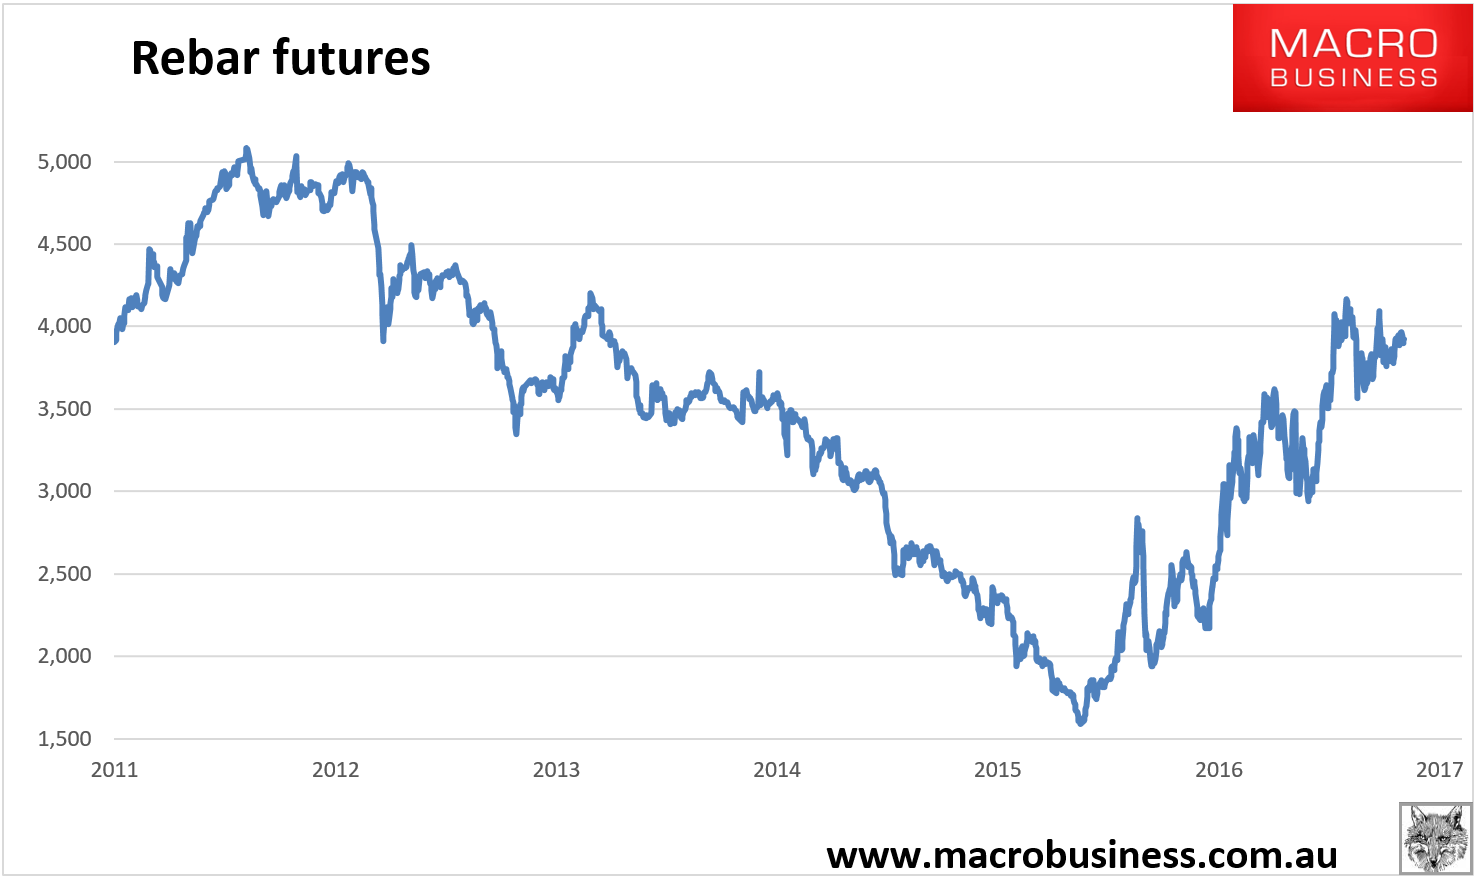
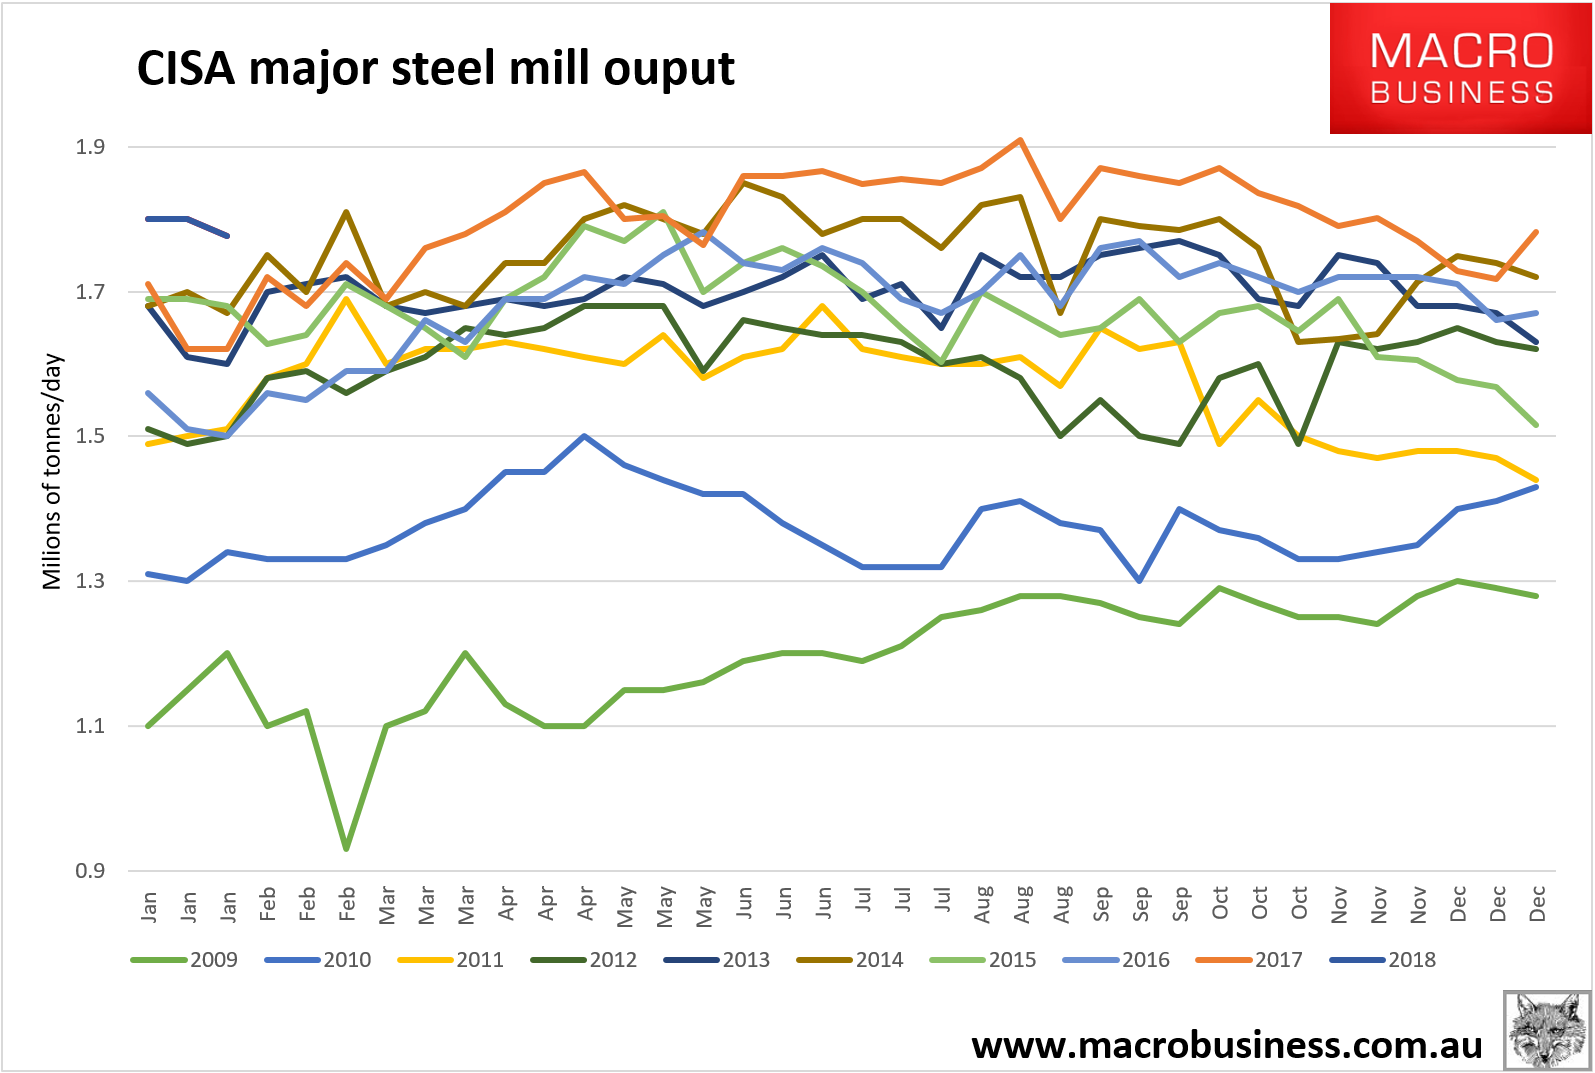
Tianjin benchmark up $1.30 t0 $77.85. Paper too. Steel stuck. We’re range trading. CISA output fell 1.3% in late January. Not a great sign for demand.
More on discounts today:

Iron ore price charts for February 13, 2018:
Tianjin benchmark up $1.30 t0 $77.85. Paper too. Steel stuck. We’re range trading. CISA output fell 1.3% in late January. Not a great sign for demand.
More on discounts today:
The full text of this article is available to MacroBusiness subscribers