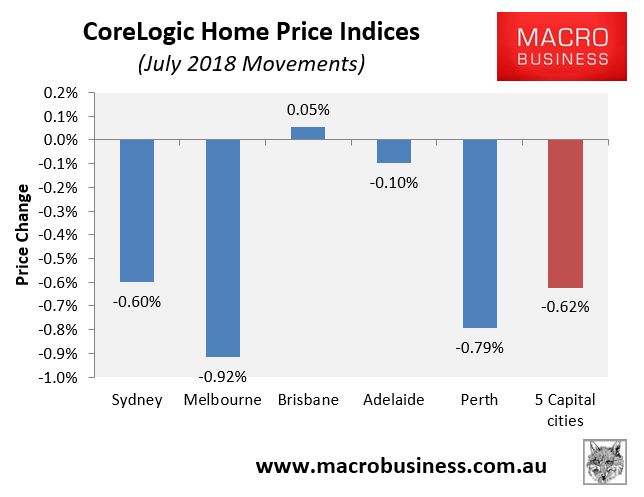
CoreLogic’s dwelling price results are in for July, with another 0.62% decrease in values recorded over the month at the 5-city level:
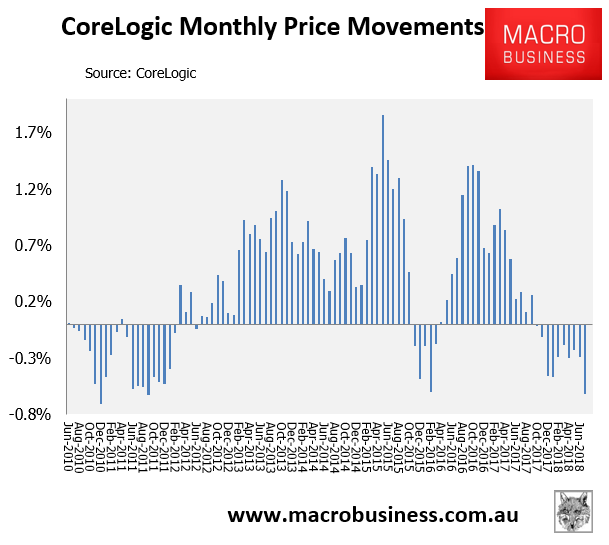
It was the 10th consecutive monthly decline in home values, with values down a cumulative 3.0% over that period at the 5-city level:
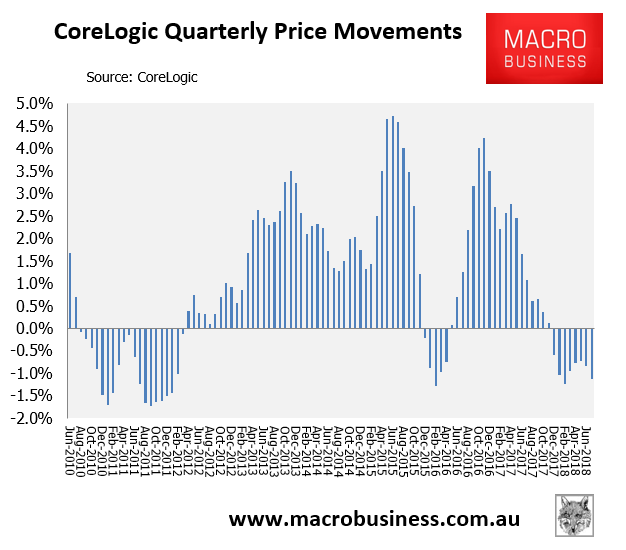
Quarterly values also fell another 1.1%:
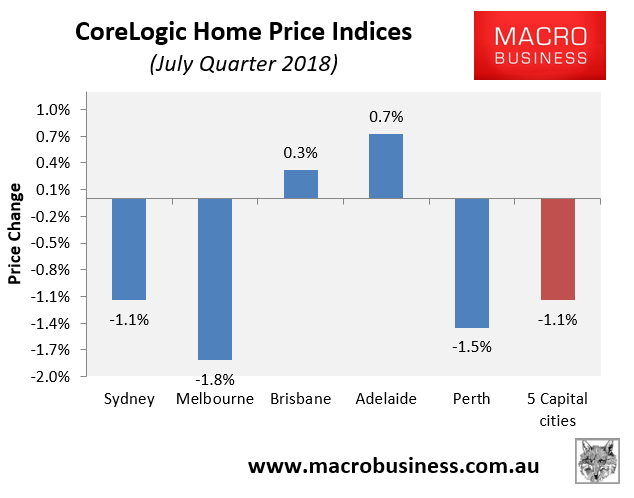
Over the July quarter, values were down in Melbourne, Sydney and Perth but rose elsewhere:
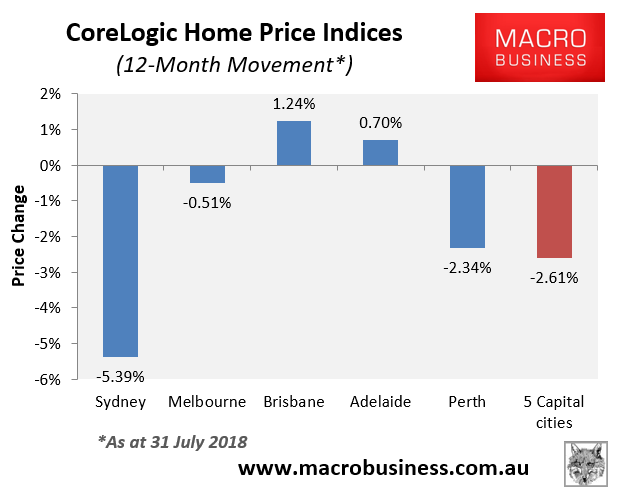
In the year to July, home values fell by 2.61% at the 5-city level, driven by Sydney (-5.39%):
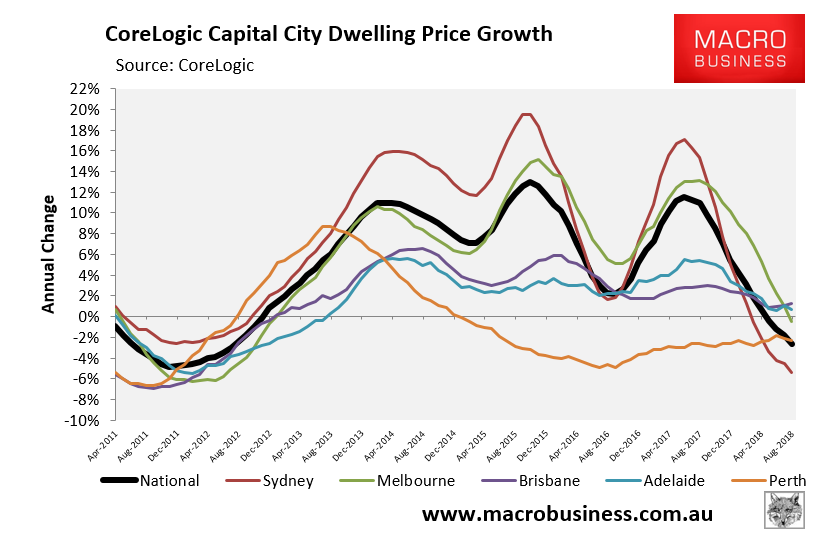
The next chart, which tracks trend annual price growth, shows a weak trend across most markets, especially Sydney and Melbourne:
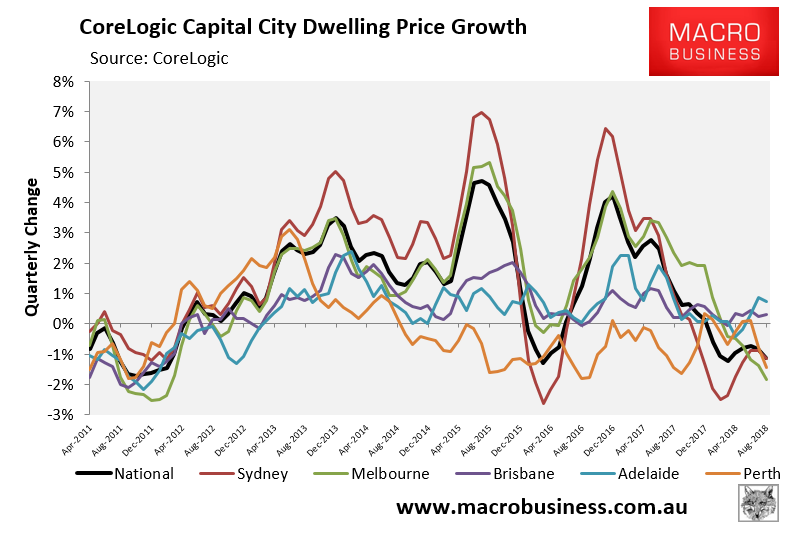
The below chart tracks price growth on a quarterly basis, with Melbourne now the weakest market:
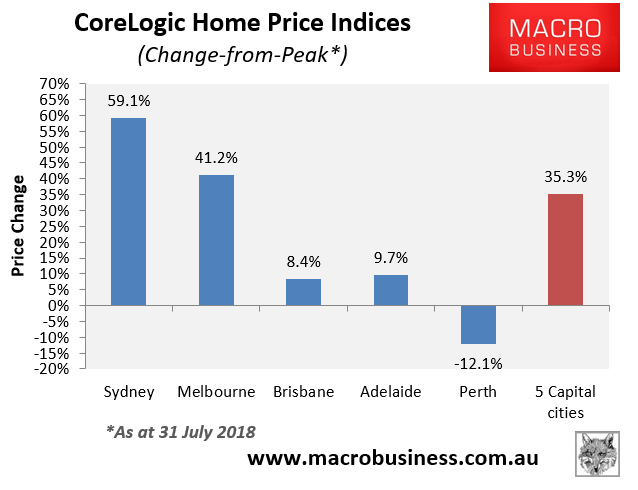
Values are now 35.3% above the June 2010 peak at the 5-city level, driven almost entirely by massive growth in Sydney (+59.1%) and to a lesser extent Melbourne (+41.2%), whereas the other major capitals have not done a lot (down in real inflation-adjusted terms):
The above data confirms that Sydney and Melbourne have entered a housing correction, with the situation appearing to deteriorate in July.