See our Coronavirus data Dashboard for individual country data.
COVID-19 statistics and cases around the World
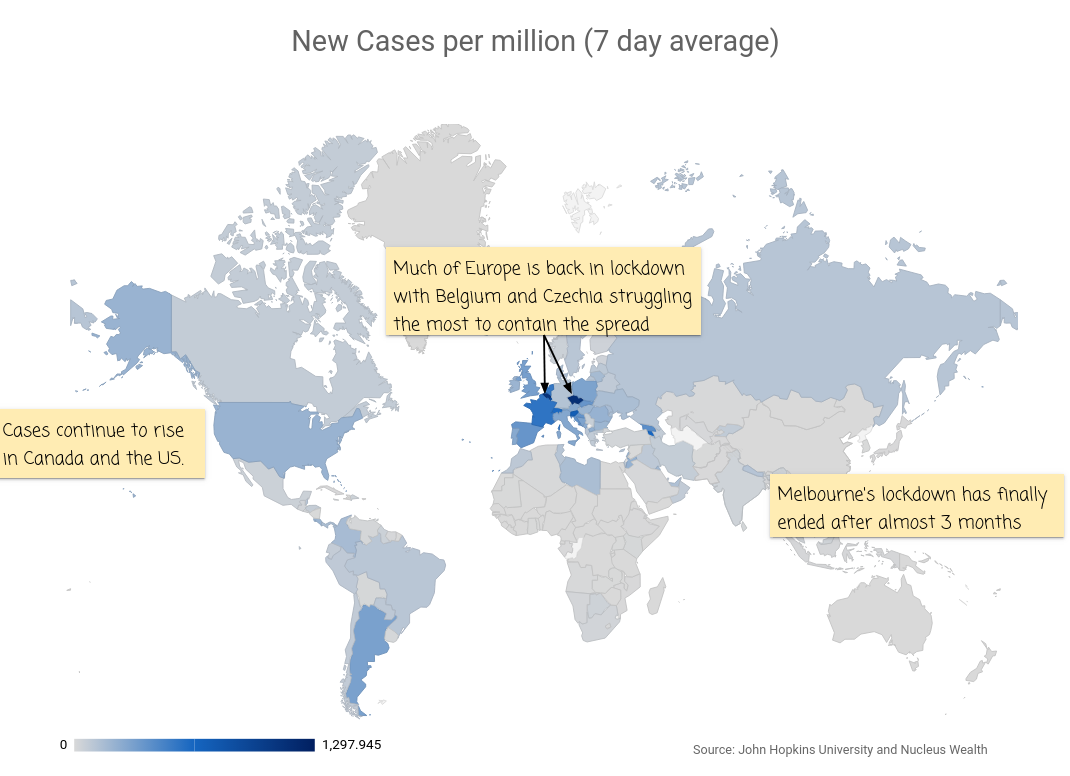
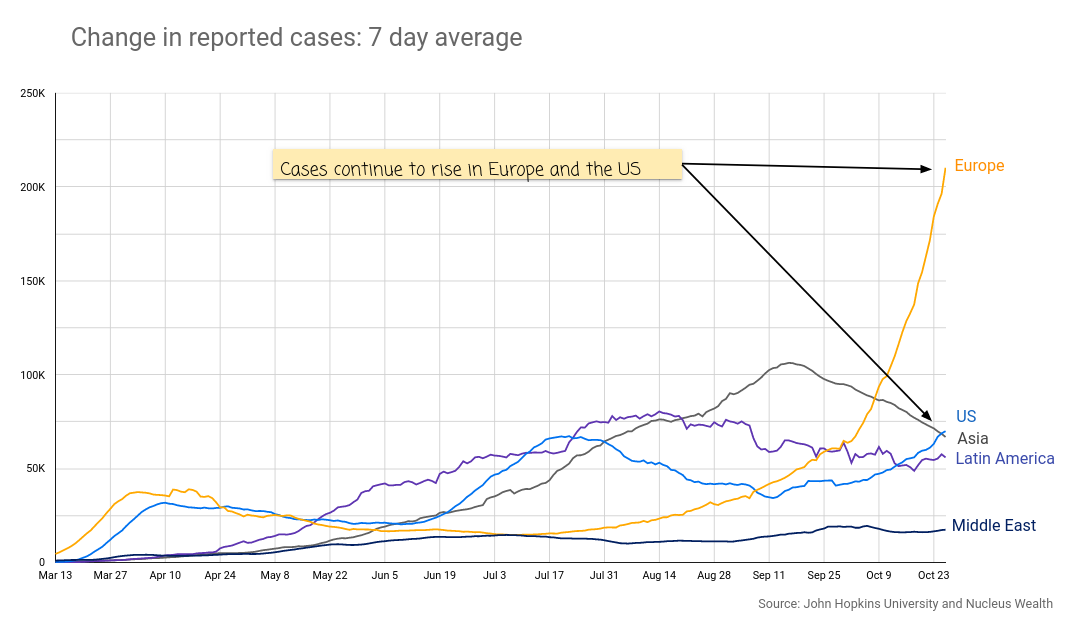
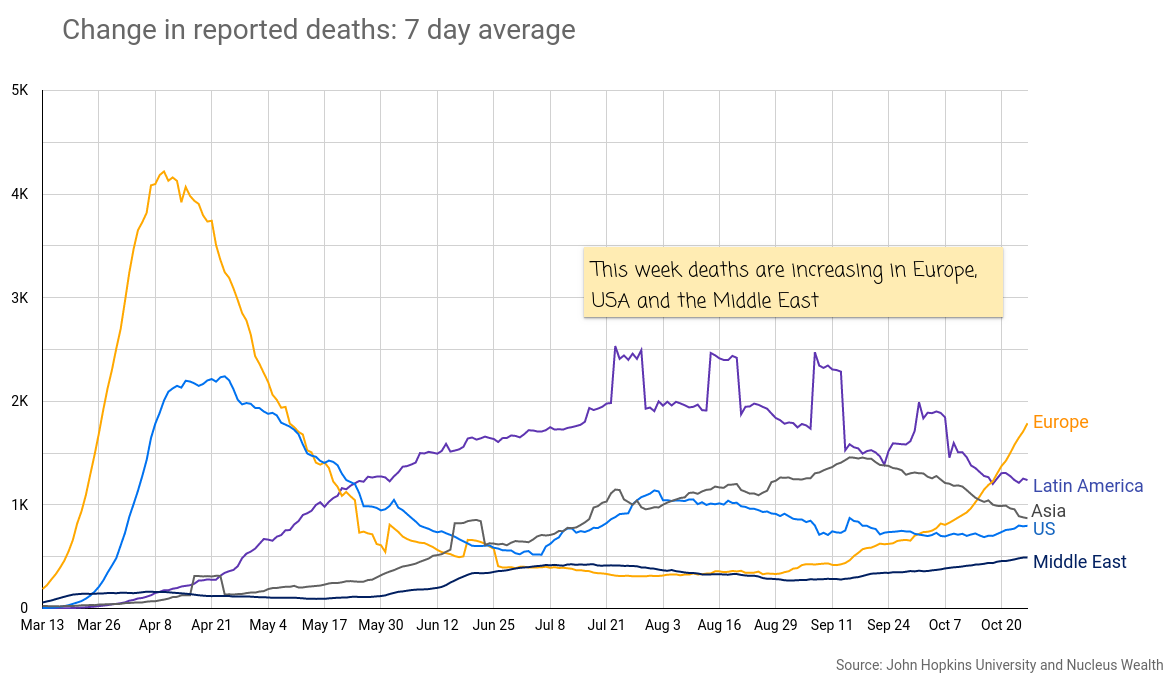
Victoria vs Europe
A few weeks ago I made the comparison between Ireland and Victoria due to their similarity in population size and looking at the effectiveness of Ireland’s lockdown. Now as Melbourne come out of restrictions Ireland have headed into their second strict lockdown. The most significant difference between Ireland and Victoria is that Ireland’s international borders have remained open. This is the greatest challenge across European countries as closing borders is unsustainable due to high density border populations and trade.
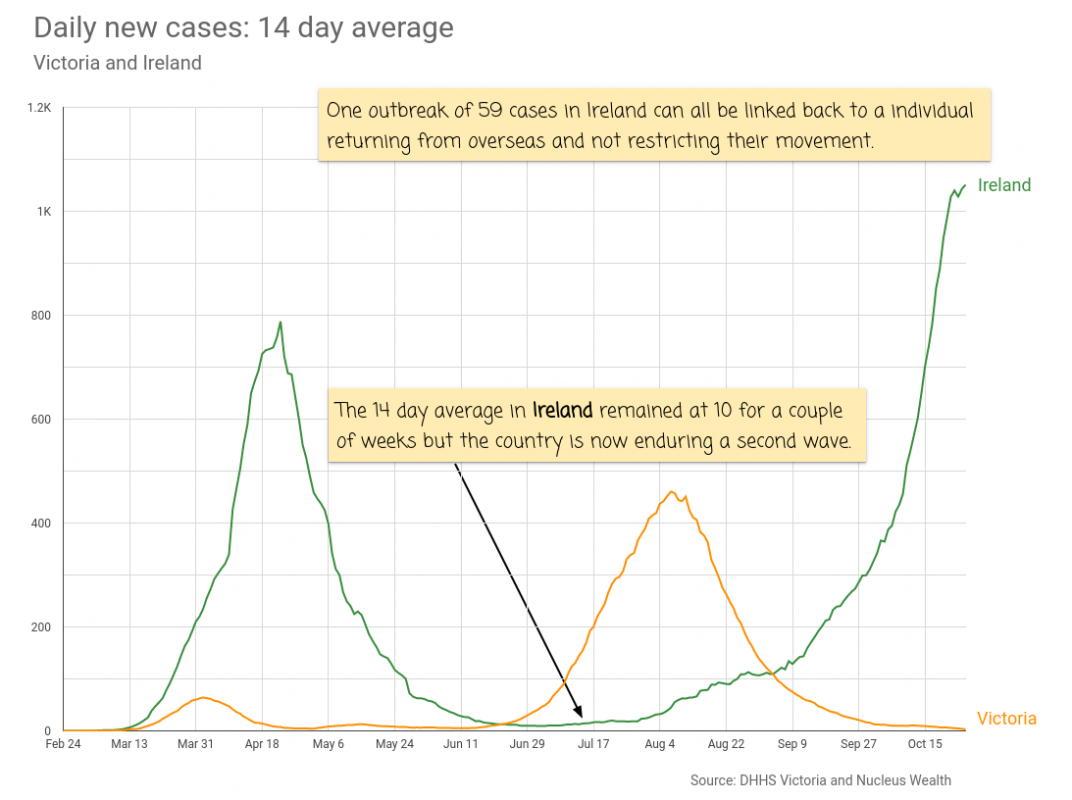
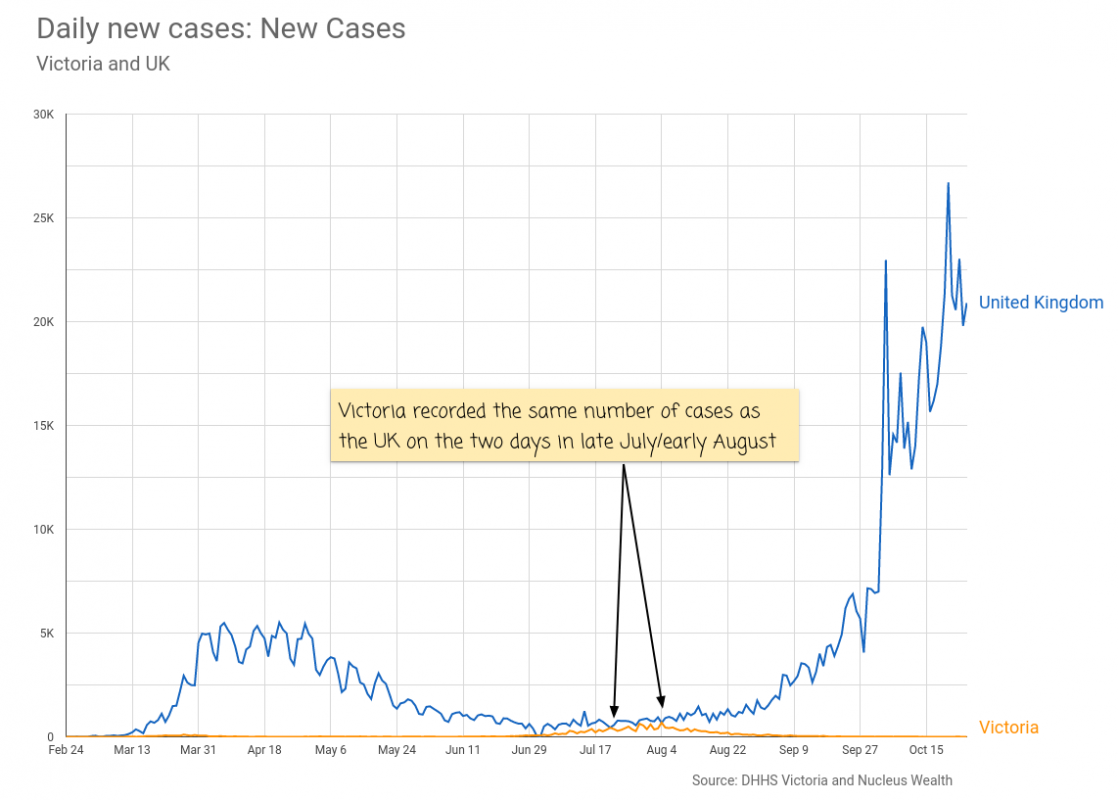
Although the graph below is not adjusted for population size it highlights the effectiveness of Victoria’s lockdown in contrast to the significant second wave happening in the UK.
While Melburnians are only now getting a since of freedom Londoners have been able to go to the pub throughout their second wave.
More COVID-19 Statistics and Analysis
See our latest blog posts or podcasts here. See our Coronavirus data Dashboard for individual country data
Data sources
This is a list of some of the main data sources we use:
https://www.worldometers.info/coronavirus/ Probably the best source of the latest COVID-19 statistics
https://medium.com/@tomaspueyo/coronavirus-the-hammer-and-the-dance-be9337092b56 Tomas Pueyo has written a number of very good summaries of the strategies to overcome coronavirus
https://www.capitaleconomics.com/the-economic-effects-of-the-coronavirus/ Good source of fast-moving China economic stats.
https://bnonews.com/index.php/2020/02/the-latest-coronavirus-cases/ If you want to be bombarded with every breaking news story, this is the place
https://ncov.dxy.cn/ncovh5/view/pneumonia Faster than worldometers for Chinese data, but slower on rest of the world data. I don’t think China cases matter anymore.
https://www.who.int/emergencies/diseases/novel-coronavirus-2019/situation-reports I’m less enamoured of the WHO data now than I was at the start of the crisis. They are providing less information now than they were at the start of the crisis, and it sometimes contradicts country-level data.
https://gisanddata.maps.arcgis.com/apps/opsdashboard/index.html#/bda7594740fd40299423467b48e9ecf6 The prettiest pictures, but one of the slower sites to update. I don’t find the charts that useful.
https://www.youtube.com/user/MEDCRAMvideos has a daily youtube wrap-up
https://www.youtube.com/user/ChrisMartensondotcom has a daily youtube wrap-up
https://www.dhhs.vic.gov.au/victorian-coronavirus-covid-19-data
Denise O’Sullivan is a data scientist at the Macrobusiness Fund, which is powered by Nucleus Wealth.
The information on this blog contains general information and does not take into account your personal objectives, financial situation or needs. Past performance is not an indication of future performance. Nucleus Wealth Management is a Corporate Authorised Representative of Nucleus Advice Pty Ltd – AFSL 515796.