Sydney’s nascent house price crash has hit a new milestone, according to the CoreLogic daily dwelling values index.
The quarterly rate of decline accelerated to 6.1% on 4 September – the fastest fall this cycle and the worst result since March 1983:
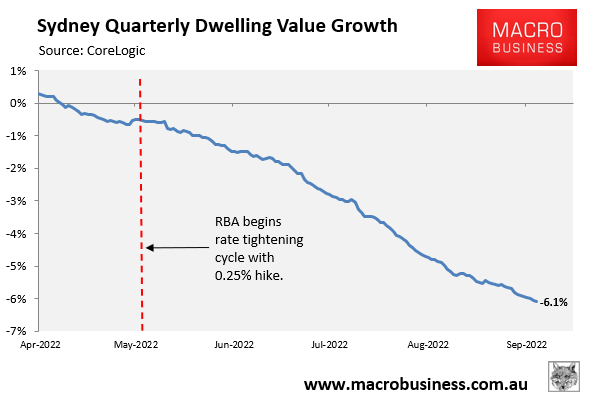
Sydney quarterly dwelling values are falling at their sharpest pace since 1983.
Sydney’s peak-to-trough decline has now hit 7.6%, with 7.0% of that fall occurring after the Reserve Bank of Australia’s (RBA) initial interest rate hike in early May:
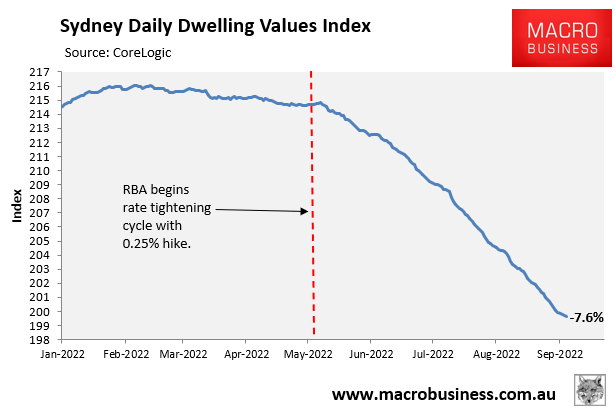
Sydney dwelling values have fallen sharply in response to rising interest rate.
The next chart uses month-end CoreLogic data to measure Sydney’s current housing correction (shown in black) against prior episodes:
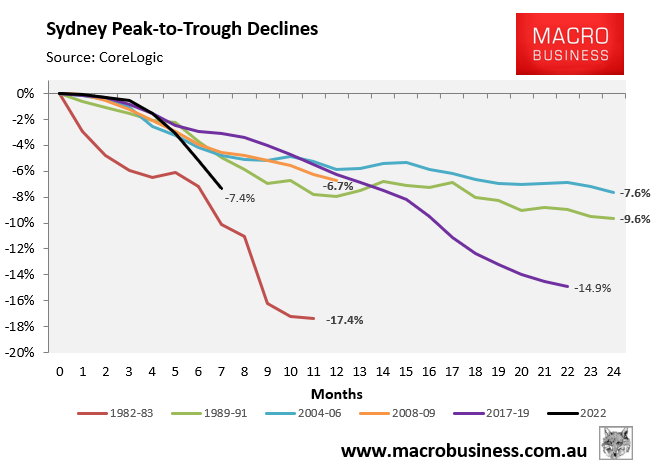
Sydney’s current correction the second steepest on record.
Sydney’s current correction has a long way to go before it reaches the depths of the 1982-83 bust (-17.4% over eleven months) or the 2017-19 correction (-14.9% over 23 months). However, the current rate of decline is the second fastest on record at this stage of the downturn (seven months in), with the pace of decline also accelerating sharply over the past quarter (as shown in the first chart above).
Ultimately, how far Sydney house prices fall will depend on how aggressively the RBA hikes interest rates, given higher mortgage rates lower borrowing capacity and reduce housing demand. Sydney has the nation’s most expensive houses with the most indebted households. Therefore, it is most sensitive to rate hikes.
Economists and the bond market expect the RBA to lift the official cash rate another 0.5% today to 2.35%, marking the fifth consecutive rise. Thus, we should expect house prices to continue falling in response.
The bottom won’t arrive until after the RBA stops increasing rates, whenever that is.
