The Australian Bureau of Statistics (ABS) has released monthly and quarterly inflation data to March, which has given mixed readings on Australia’s inflationary pulse.
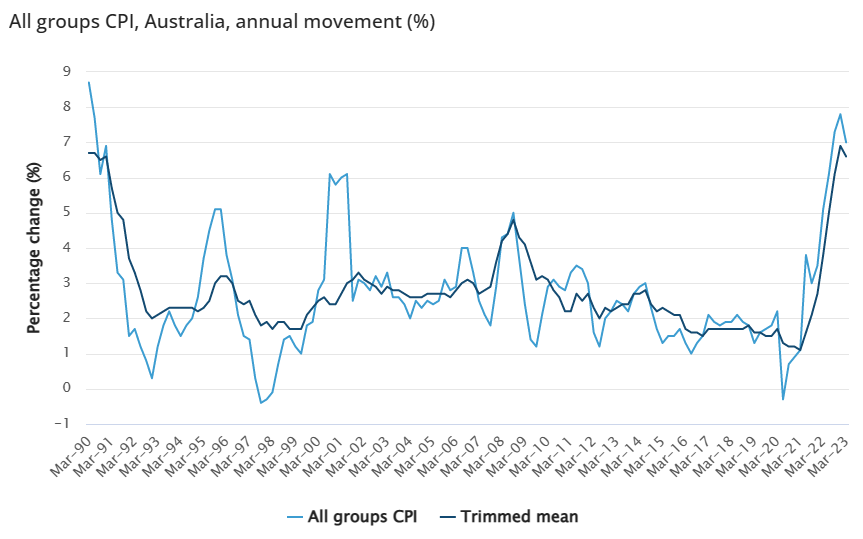
Quarterly headline CPI rose 1.4% (versus 1.3% expected), with annual inflation rising 7.0%.
However, the trimmed mean (underlying) inflation came in at 1.2% over the quarter (versus 1.3% expected), with annual trimmed mean inflation coming in at 5.8% (expected 5.9%):
The next chart plots quarterly headline inflation across the key sub-categories:
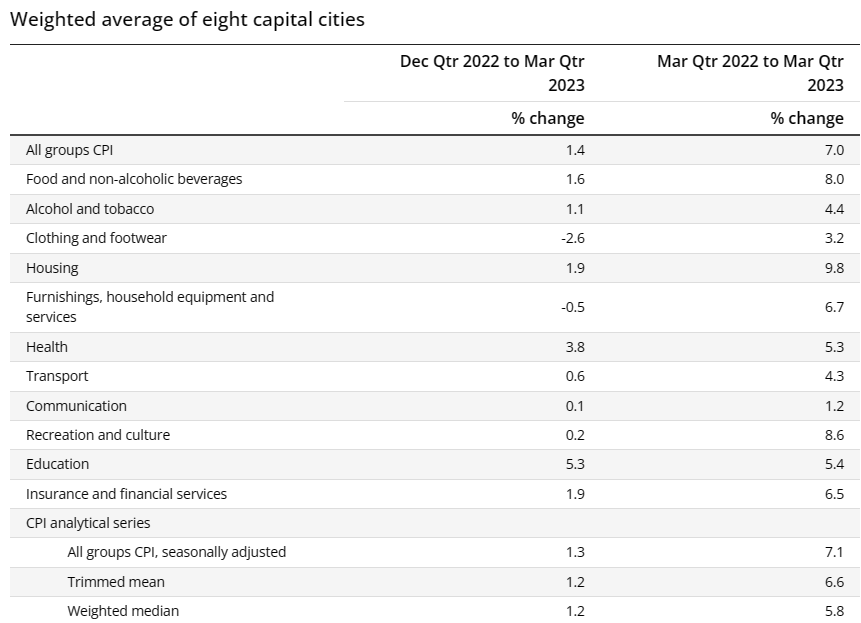
Housing (construction and rents) continues to drive inflation higher, with prices rising 1.9% over the quarter to be up 9.8% year-on-year.
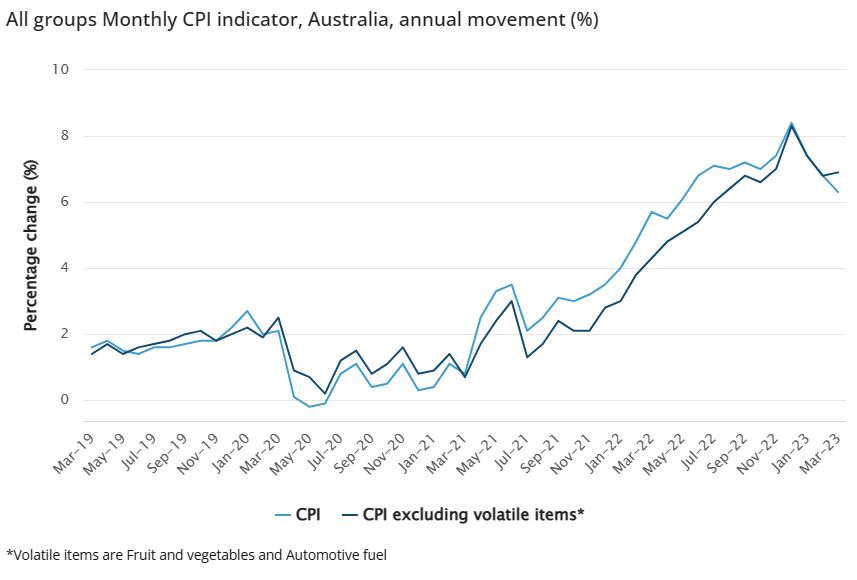
On the other hand, the monthly inflation gauge suggested that underlying inflation (i.e. excluding volatile items) actually picked up marginally in March, with annual growth rising to 6.9% (from 6.8% in February):
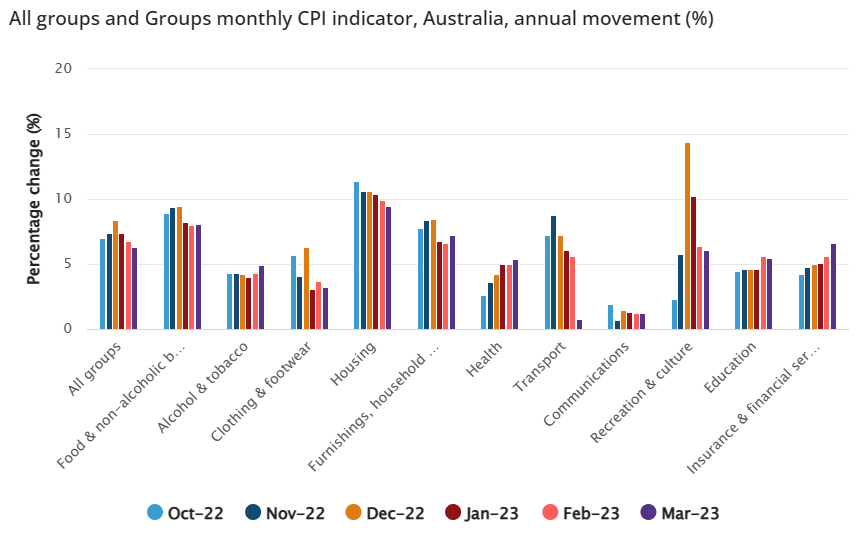
The next chart plots the monthly inflation gauge across the various categories:
There’s no ‘smoking gun’ in these releases to prompt the RBA to moving into a tightening bias.
Inflation has likely peaked; although the RBA may choose to hike one more time just in case.