By Harry Ottley, Associate Economist at CBA:
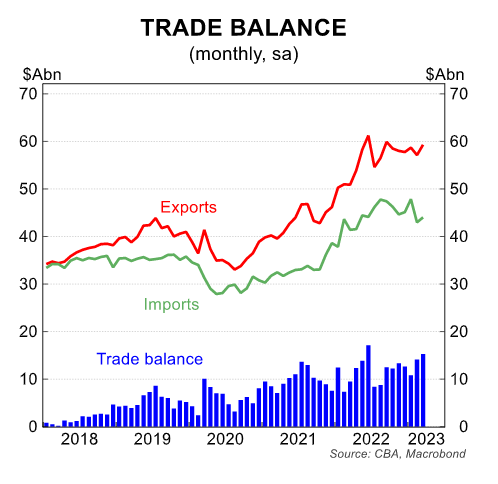
- The trade surplus widened to $A15.3bn in March to be the second largest on record.
- Exports rose by 3.8%, driven by metal ores and minerals.
- Imports rose by 2.5%, driven by a bounce back in passenger vehicles.
- Net exports are expected to detract ~0.5ppts from GDP in Q1 2023.
Another bumper Australian trade surplus has been recorded in March 2023.
The surplus widened from an upwardly revised February result, increasing by $A1.1bnto $A15.3bn, driven by a strong gain in exports (+3.8%).

The result was above both our and market expectations with lower commodity prices in March failing to dampen the value of Australian resources exports.
The facing chart of the rolling 12 month trade balance highlights how unprecedented the current strength in the external sector is.

Exports rose by 3.8% in the month, driven by metal ores and minerals (+11.6%/mth) which mostly consists of iron ore.
Other major lines of non-rural goods exports were mixed with a monthly gain in coal (+1.9%/mth) but a contraction in oil and gas (-5.7%).

These three components make up ~60% of Australia’s total export market.
Rural exports recorded a solid gain, up 10.9%/mth to $A6.7bn in the month.
The rise was broad based with meat (+13.5%/mth) and grains (+14.0%/mth) driving the result.
Services exports continue to push higher, though the rate of growth is slowing (+0.9%/mth). The level is now approaching the pre-covid level but remains about 9% below the November 2019 peak.
Total imports rose by 2.5%/mth but the trend is still pushing lower. The level of total imports is similar to mid last year and this is why near record surpluses are still being recorded despite the level of exports plateauing over the same period.
The rise in imports was driven by a bounce back in passenger vehicles (+23.9%/mth) following a very large drop last month. This pushed total consumption goods imports 14.1%/mth higher while capital goods fell by 2.5%/mth and intermediate goods were close to flat
Services imports fell by 1.3%/mth with tourism related imports 3.3% lower (Australians travelling offshore). This may be being influenced by lower international travel prices as evidenced in the Q1 23 CPI.
Tourism related services exports remain on an upward trajectory but imports have been trending lower since mid-last year which is pushing the tourism trade balance higher.
The value of the Q1 23 trade surplus has come in at ~$A40bn compared to ~$A38bn in Q4 22 due to an increase in nominal exports and a decrease in nominal imports.
Based on these figures and taking into account the movements in export and import prices over the quarter, we anticipate net exports will contract ~0.5ppts from economic growth when the national accounts are released on 7 June.
Given the expected slowdown in consumer spending as well as these trade numbers, GDP for Q1 23 is facing some significant headwinds.

