On Thursday, I reported that the Real Estate Institute of New Zealand (REINZ) House Price Index, which adjusts for differences in the mix of properties sold each month, fell by another 0.8% in April, and is now down 17.5% from its November 2021 peak.
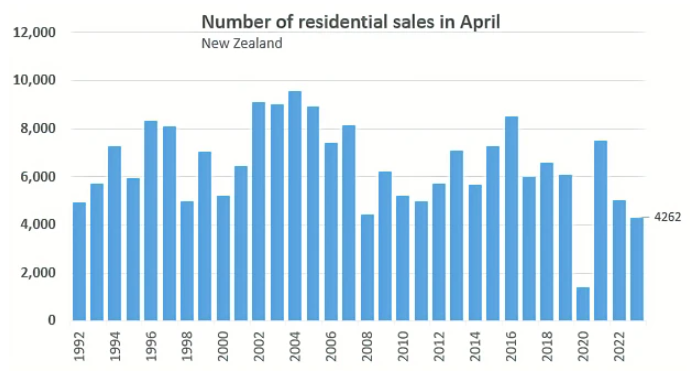
The REINZ also reported the lowest volume of April sales on record, outside of the national pandemic lockdown in 2020:

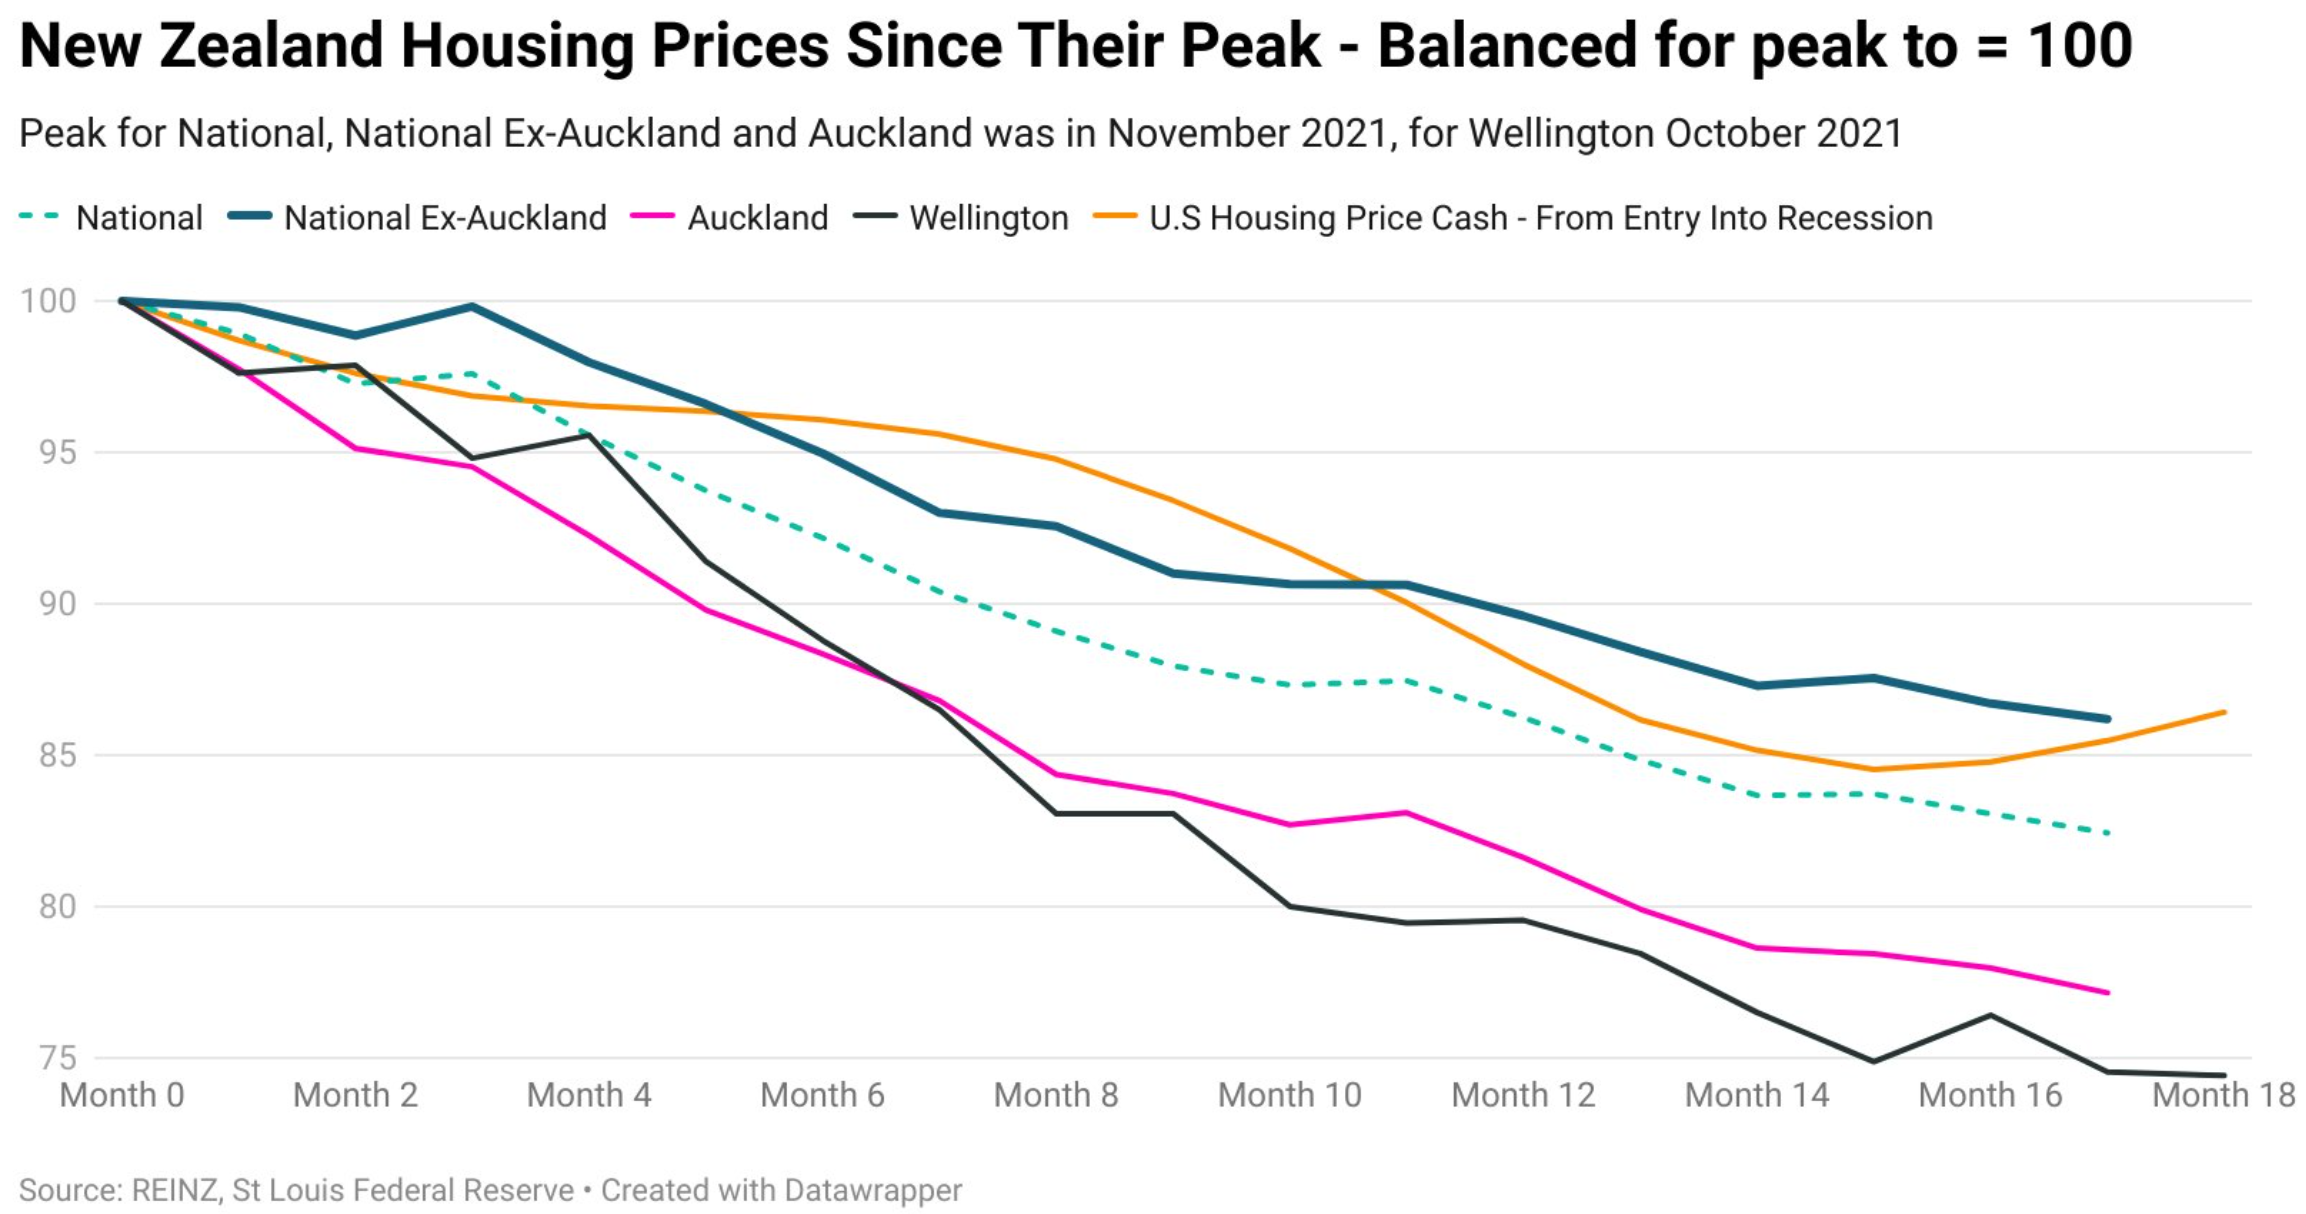
Independent economist Tarric Brooker published the below chart on Twitter plotting the peak-to-trough decline across New Zealand’s housing market:

The peak-to-trough declines are as follows across the major markets:
- National -17.6%
- National (ex-Auckland) -13.8%
- Auckland -22.8%
- Wellington -25.6%
Brooker’s chart also shows that the Auckland/Wellington housing crash is far worse than the United States GFC falls.
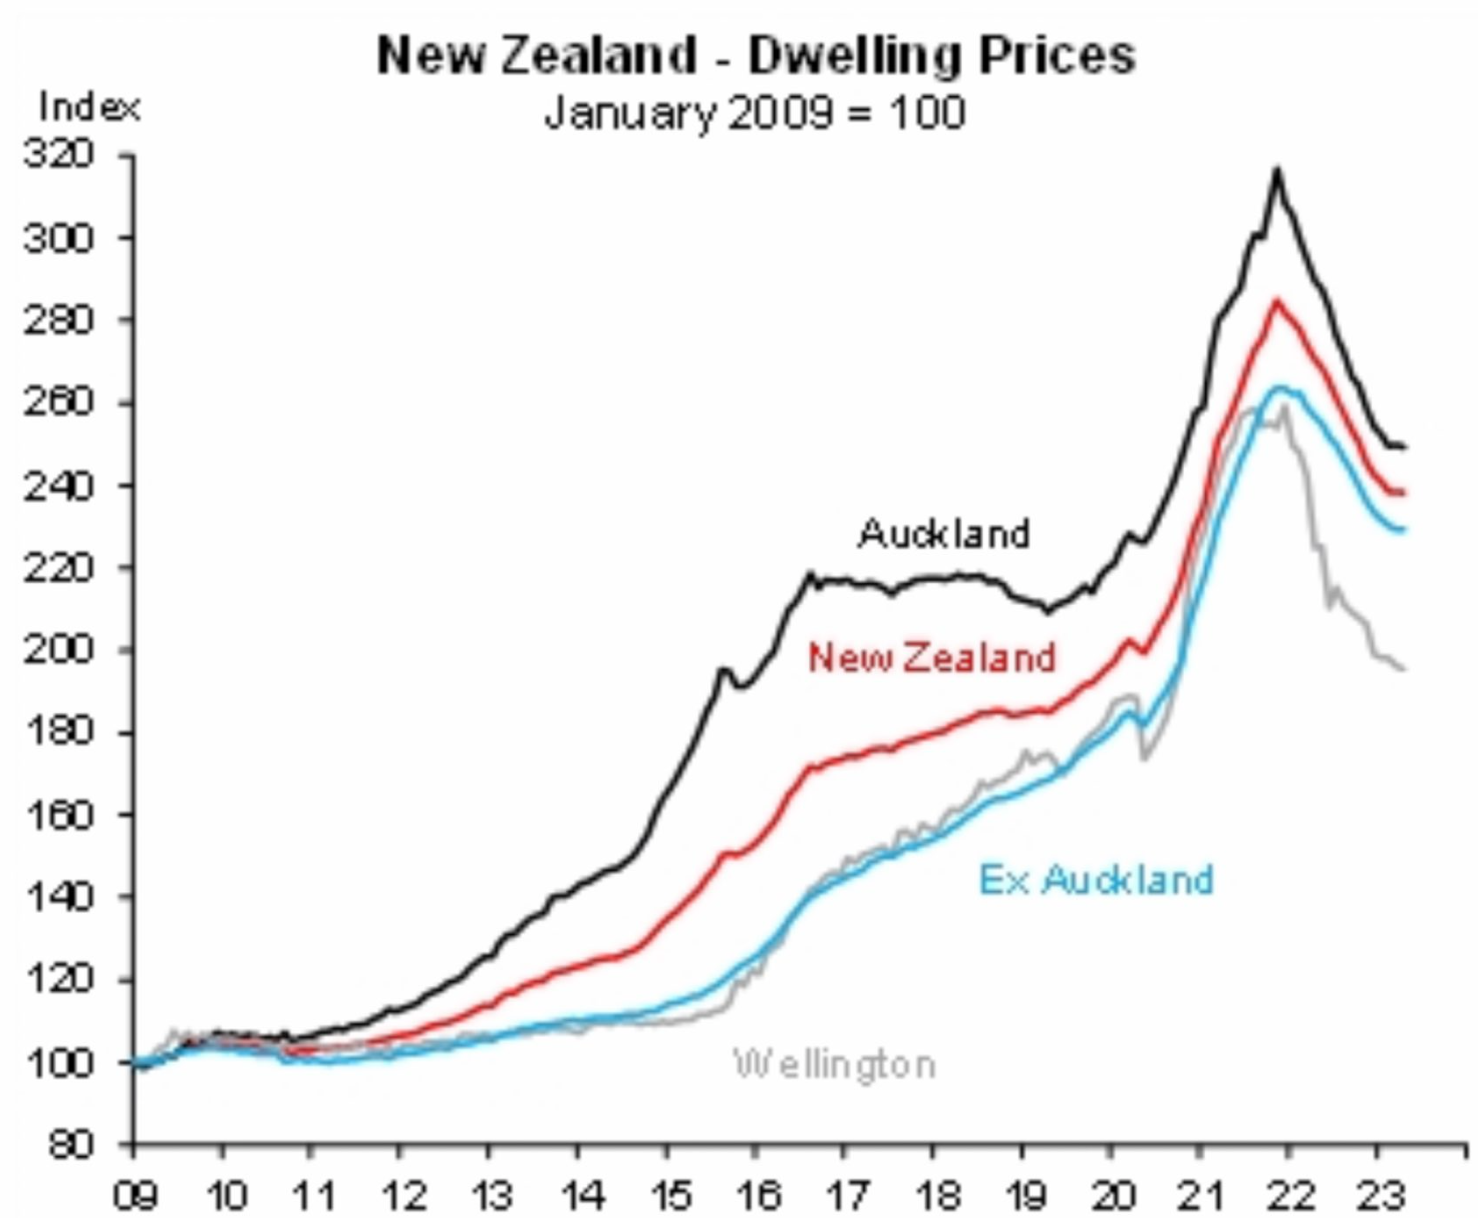
Separately, AMP Capital chief economist, Shane Oliver, posted the below chart on Twitter showing the extent of the price falls in an historical context:

The 40% run up in prices over the pandemic has been followed by the sharpest price crash in generations.
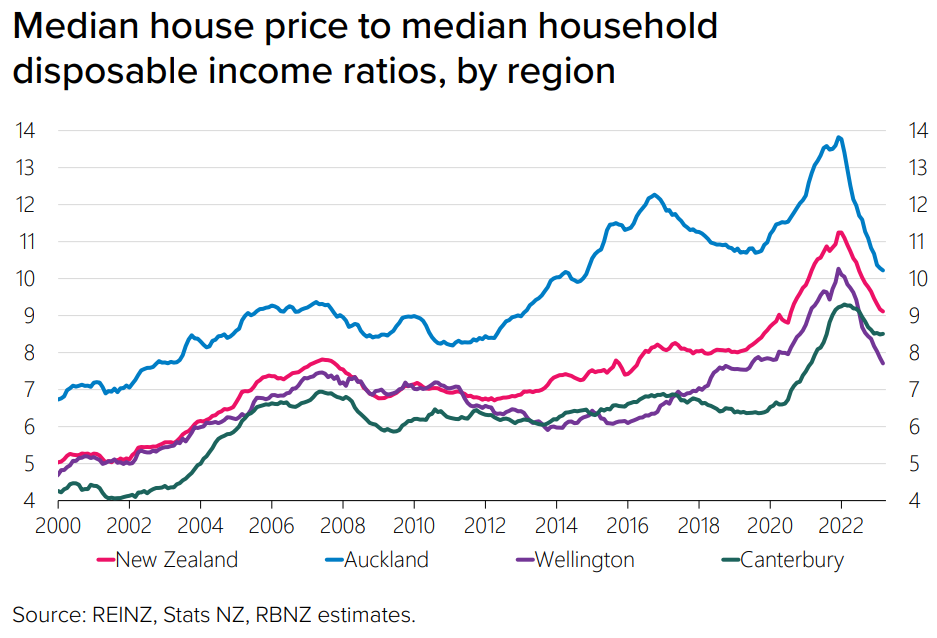
Even so, price-to-income rations remain elevated relative to historical experience, especially given the current high interest rate settings:

Oliver questions whether “NZ dwelling prices [are] showing signs of bottoming (like Aust and US)” with the “‘sticker shock’ of rate hikes fading”?
Or, are “more price falls to come after a bounce as rates hikes have their lagged impact on the economy (and hence property demand and supply)”.
My view is that New Zealand house prices will probably fall until the October election, after which uncertainty will lift.
The economy is expected to slide into recession in this period, while the Reserve Bank is unlikely to loosen monetary policy before then.
That said, just like Australia immigration is bouncing back hard in New Zealand.
Thus, when the Reserve Bank does begin to ease, house prices could bounce back hard.

