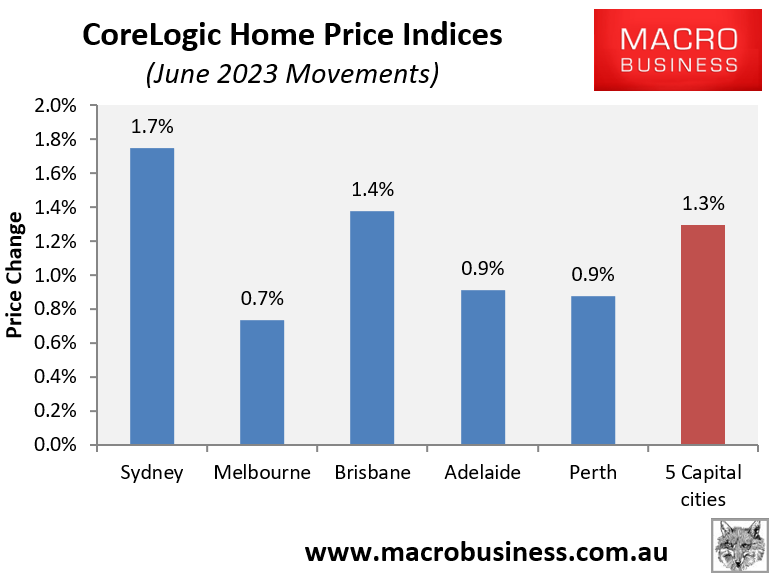
CoreLogic’s daily dwelling values index reported a 1.3% increase in value in June across the five major capital cities, led by a 1.7% rise across Sydney:

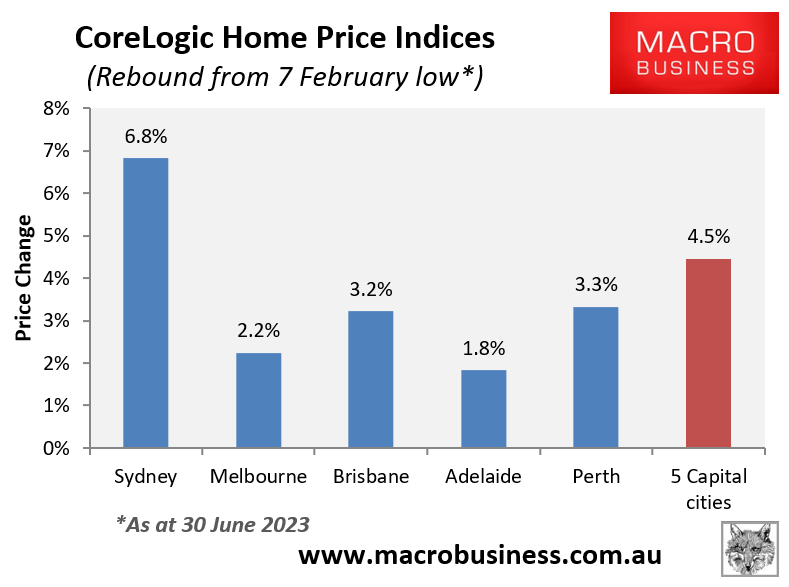
Since bottoming on 7 February, values have now risen by 4.5% at the 5-city aggregate level, again led by a 6.8% rebound across Sydney:

After leading the nation’s housing downturn after the Reserve Bank of Australia (RBA) began hiking rates in May last year, Sydney is now leading the rebound.
Sydney recorded a peak-to-trough decline in home values of 14% between February 2022 and February 2023, and has since rebounded by 6.8% since then.
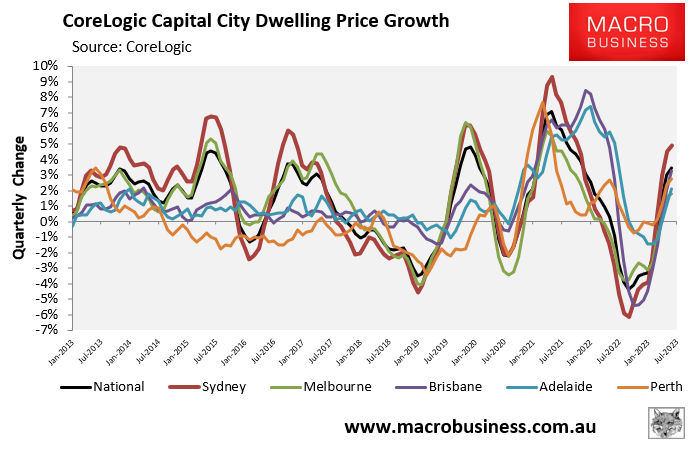
The next chart plots quarterly dwelling value growth across the major capital city markets over the past decade:

As you can see, Sydney (shown in red) typically leads the nation’s upswings as well as the downturns.
Put simply, Sydney is the nation’s most volatile housing market.
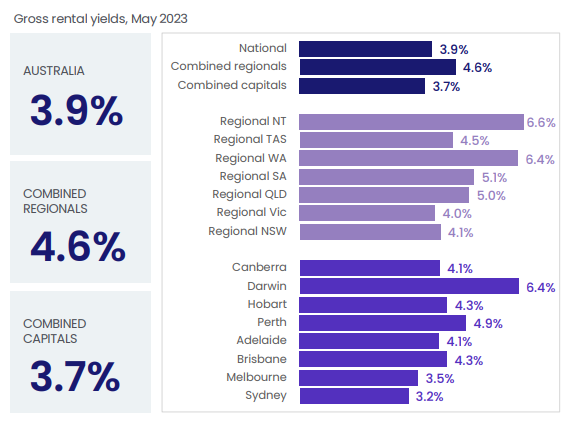
The reason for this volatility is that Sydney is by far the most expensive housing market in the nation when measured against both incomes and rents.

Sydney’s rental yield is the lowest in the nation.
This expensiveness has made Sydney housing more sensitive to swings in demand, for example changes in interest rates or immigration flows.
Accordingly, Sydney housing is a boom-bust volatility machine that swings up and down like a yo-yo.

