CBA senior economist Belinda Allen has produced an excellent analysis of federal and state government capital expenditure.
Allen estimates that public sector capex should add around 0.2% to Australia’s GDP in 2023-24.
It will also add to inflation in the short-term before boosting productivity and contributing to lower inflation over the medium and longer-terms.
Key Points
- Public capex is projected to total $A119.9bn in 2023/24, or about 4.6% of GDP.
- If all this public capex work occurs, this should add around 0.2 percentage points to 2023/24 GDP growth.
- This is a step down from the expected 0.6 percentage points added to GDP growth in 2022/23.
- State capex pipelines remain large despite some state governments facing budget challenges and have shifted higher in the out years.
- The large pipeline of work has contributed to cost increases in the short term, but over the medium term will improve productivity and push down on inflation.
With all state and territory budgets (NSW the exception) now released we analyse how public sector capex is shaping up for 2023/24 and beyond.
We note the NSW Budget for 2023/24 has been delayed for three months, the normal practice due to a change in government.
We will refresh the numbers once the NSW Budget is handed down in September. In this analysis we use the NSW Mid-Year Review 2022/23 numbers.
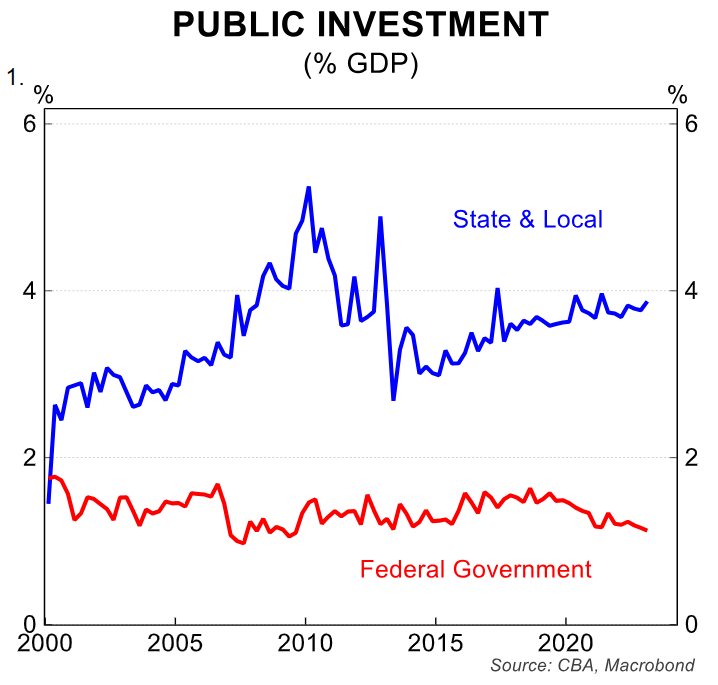
In recent years state governments have lifted public capex, particularly through infrastructure spending on transport initiatives. As a result the share of state government investment as a share of GDP has risen (chart 1) over recent years.
Adding up public capex in the state and Federal budgets shows there is another year of spending growth due to take place in 2023/24 after a slightly larger spend in 2022/23 than originally estimated.
State governments are still catching up on capex that was due to take place during 2020 and 2021. Rising costs would also be inflating the numbers.
Some state governments have also lifted efforts to help the energy transition in Australia by investing in renewables and the grid.
As it stands the capex pipeline grows in 2023/24 at the state government level and again in 2023/24 (on current NSW numbers). State government budgets, particularly in NSW and Vic however, are under pressure.
As we discuss below, Vic has slightly wound back its infrastructure spending in the out-years in the 2023/24 Budget.
Investment, both private and public is a key component of the economy.
Capex adds to GDP as the spending takes place and creates employment. It also has an important medium term impact as it lifts productivity and capacity in the economy and provides inflation relief.
Public sector capex plans remain strong for 2022/23
Adding up capex plans from the Federal and state budgets shows capex of $A119.9bn is expected for 2023/24 (see Table 1). On our calculations this equates to around 4.6% of GDP.
If spending is delivered in line with these plans, a lift of 4.6% in 2023/24 would be recorded. On our calculation this would contribute 0.2%pts to annual GDP growth in 2023/24.
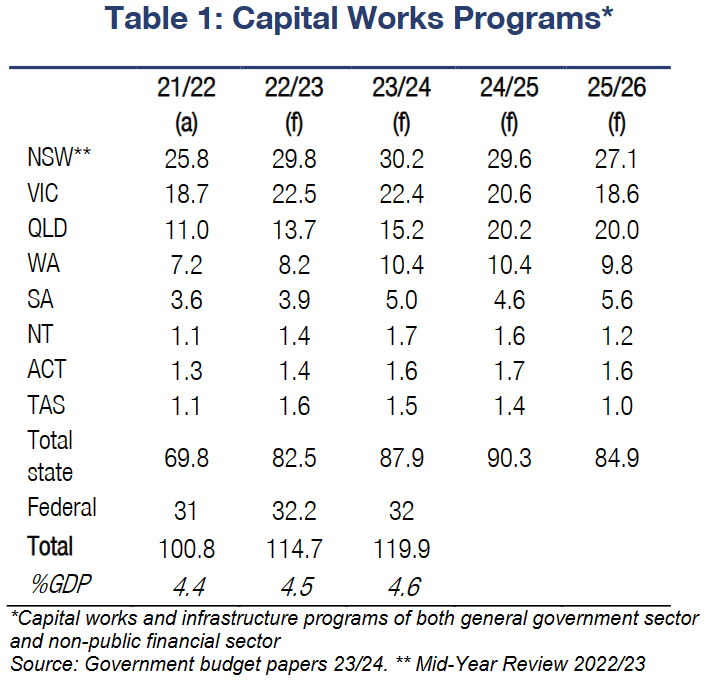
Compared to 2022/23, the lift in capex spending is smaller in 2023/24. Based on current numbers a lift of 13.7% is expected in the almost finished 2022/23 financial year, contributing close to 0.6%pts to GDP growth.
There are two ways to analyse the slower growth in 2023/24. First is the 13.7% growth in 2022/23 was driven partly by catch up from the pandemic period.
Digging into this in more detail and NSW and Victoria respectively recorded a lift of 15% and 20% in 2022/23 before shifting to a flat outcome in 2023/24.
We analyse the numbers and programs in detail in the next section. But as chart 2 shows, at this stage the peak in the total state capex pipeline occurs in 2024/25. Before falling slightly in 2025/26.
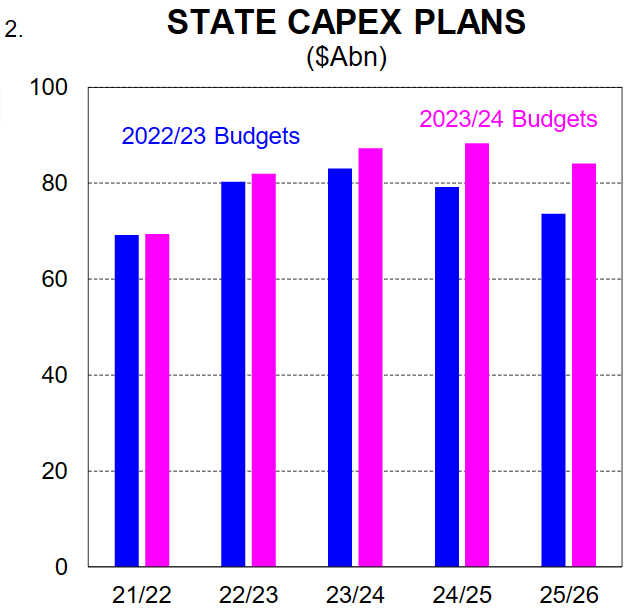
However the trend in recent budget cycles has been capex programs being revised higher. As we also note in the next section the share of each state within the total capex program shifts as the financial years’ progress.
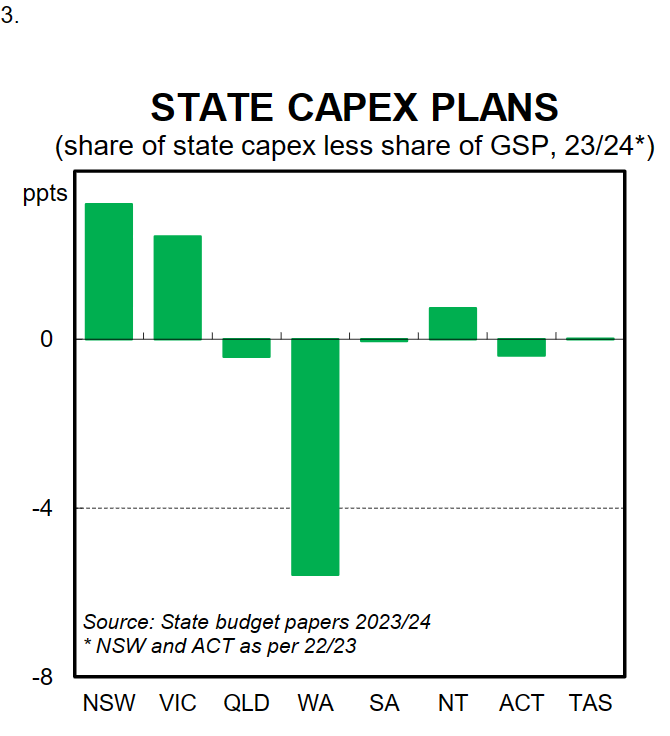
Chart 4 shows this in detail. NSW and Vic continue to have large capex plans in place relative to the size of their economies (chart 3) while Qld and WA have smaller capex plans as a share of their respective economies.
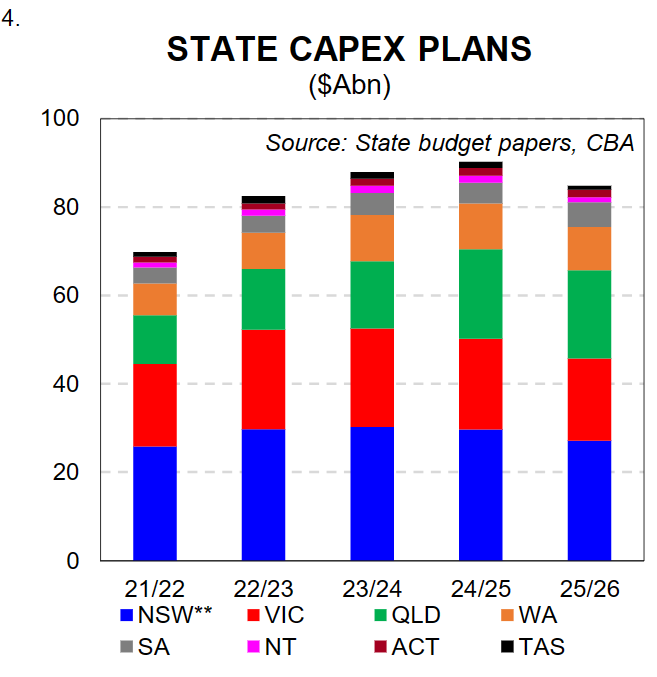
However, as we note below both WA and Qld have shifted capex spending higher in the most recent Budgets. Both states are in good position financially, benefiting from additional resources royalties. This would allow a further boost to capex in the future.
A closer look at Federal and state spending
Victoria
In Victoria, 2022/23 capex spending is expected to be a little higher than expected this time a year ago.
A total of $A22.5bn government infrastructure investment will take place, compared to estimates a year ago of $A21.4bn. In 2023/24 plans have been curtailed slightly, and are now estimated at $A22.5bn (last year reported at $A23.0bn) before continuing to retreat over coming years, falling to $A16.9bn in 2026/27.
Overall total capex has been lowered slightly in the four years to 2025/26, particularly in 2024/25 and 2025/26.
Victorian Budget papers note that government infrastructure investment will begin to return to pre covid levels over the forward estimates. The focus of the capex pipeline remains transport, health, education and social & affordable housing.
South Australia
In South Australia, there has been an expansion in the government’s investment program due to an expanded pipeline of projects.
The capex program sits at $A25.0bn for the five years to 2026/27, compared to $A21.6bn for the five years to 2025/27 in last year’s Budget.
Much of capex program continues to be devoted to the North-South Corridor, the new Women’s and Children’s Hospital & Mount Barker Hospital, hydrogen jobs plan and a new aquatic centre.
Queensland
Queensland continues to invest less than its share of GSP as we noted in chart 1. However over the last two years there has been a shift higher in the total capital program in Queensland.
Much of this shift higher has occurred in the public non-financial sector. There has been around a$A20bn lift in spend in this sector since the 20202/23 Budget a year ago, mainly due to the roll out of the QJEP –the Queensland Energy and Jobs Plan to transform Queensland’s energy system.
The capex spend includes investment in pumped hydro, grid connection and other renewable energy and storage projects.
Western Australia
In Western Australia, the Budget contained a record Asset Investment Program totalling $A39bn over four years, up from $A34bn in the 2022/23 Budget.
This expansion in investment includes a large lift in in new works, such as decarbonisation projects and a new hospital for women and children.
The Budget papers also highlight a lift in outlays due to cost escalation on existing projects driven by ongoing capacity constraints in the construction sector.
Tasmania
In Tasmania the capex and infrastructure pipeline remains large and at a very similar level to what was estimated in the 2022/23 Budget.
The focus of the spending is on roads and bridges, tourism and health care. 2022/23 and 2023/24 are the largest years of the capex spend before investment falls in 2025/26 and 2026/27.
NSW
The latest update on infrastructure and capex spending in NSW was provided as part of the Half-Yearly Review released on 7 February 2023 under the former Liberal government.
This update saw a lift in infrastructure and capital work spending by approx. $A4bn over the four years to June 2026. Increased funding for NSW’s existing rail infrastructure was one key driver for the revised spending.
The 2023/24 NSW Budget will be released in September.
Federal
The Federal Budget released in May 2023 reaffirmed the $A120bn infrastructure pipeline over 10 years. However the government is conducting a review of the economic sustainability of this pipeline.
The review will ensure the investment pipeline is focussed on projects which improve long term productivity, supply chains and economic growth in cities and regions. This review will also impact projects being undertaken with state, territory and local governments.
A shift in funding, pipelines or projects could occur as a result of the review. A number of state budgets referenced this.
New funding at the Federal government level focussed on infrastructure relating to the Brisbane Olympic Games ($A3.4bn over 10 years) and for sports and recreation in Tasmania. Both respective State governments will also contribute funding for these projects.
Capacity constraints and rising costs are a headwind
The large and growing public capex profile will remain a key driver of Australia’s economic growth over the next year. Although as we note on the first page, the size of this contribution is expected to be lower than 2022/23 as the rate of change in the pipeline slows.
Private sector capex will also be a key contributor to Australia’s economic growth. The latest capex survey in May 2023 suggested growth of ~8% in 2023/24, following~15% in 2022/23 (chart 5).
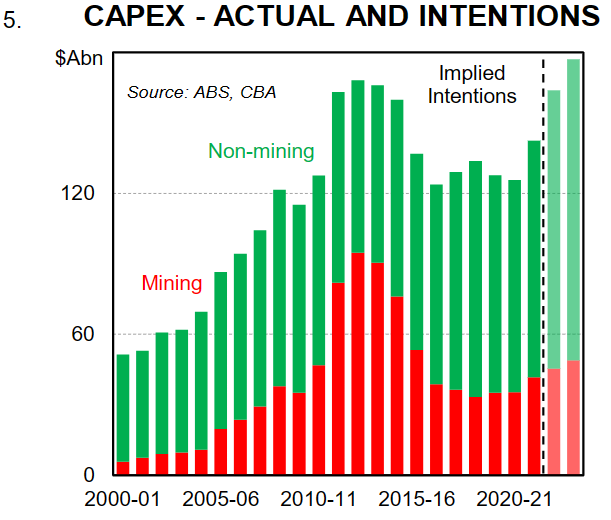
Both public and private capex growth will help offset what we expect to be a weak consumer and residential investment story.
However capacity constraints and costs are expected to remain an impediment to delivering the full pipeline over the next year or so. The past several years has seen a large amount of work planned to be done at the same time, creating capacity constraints and pushing up costs.
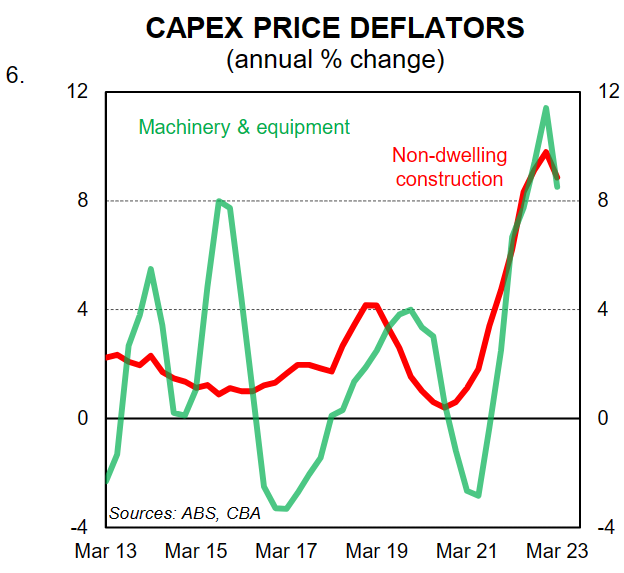
The private capex deflator is rising (chart 6) but is off the high recorded in Q4 22.
Engineering construction costs were running at 8.3%/yr as at Q1 23 in the public sector (chart 7) and 9.0%/yr in the private sector.
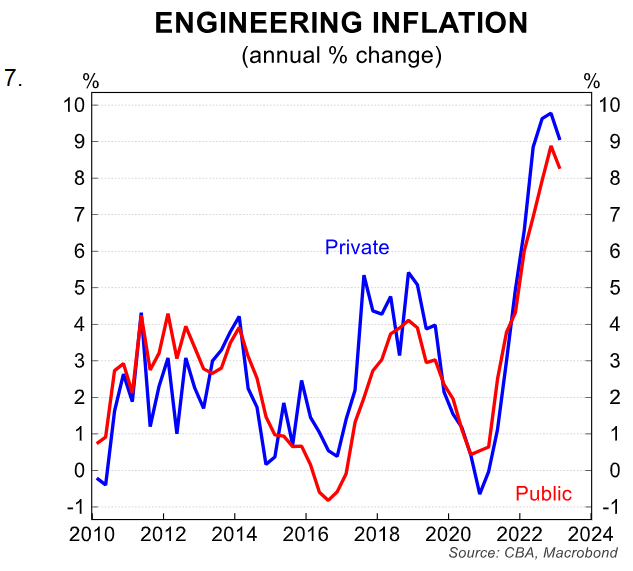
Both sectors are involved in the public sector capex build. Skilled staff shortages in engineering and construction remain a constraint despite record rates of net overseas migration (chart 8).
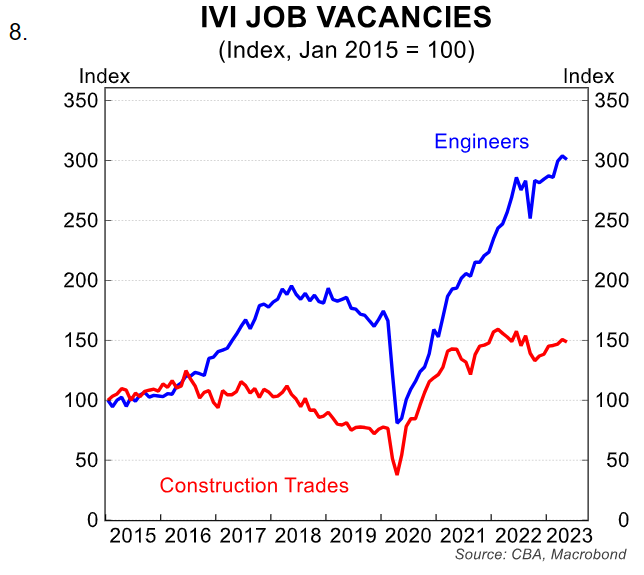
Job vacancies in these industries remain high despite a 10% fall in overall job vacancies. Staff shortages are commonly reported as being an impediment to projects being completed.
Summary
The large and still growing pipeline of federal and state government capital expenditure will support Australia’s economic growth prospects over coming years. It will also add to productive capacity in the economy and help medium term inflation prospects.
The Federal government budget bottom line has improved drastically over the past year (chart 9).
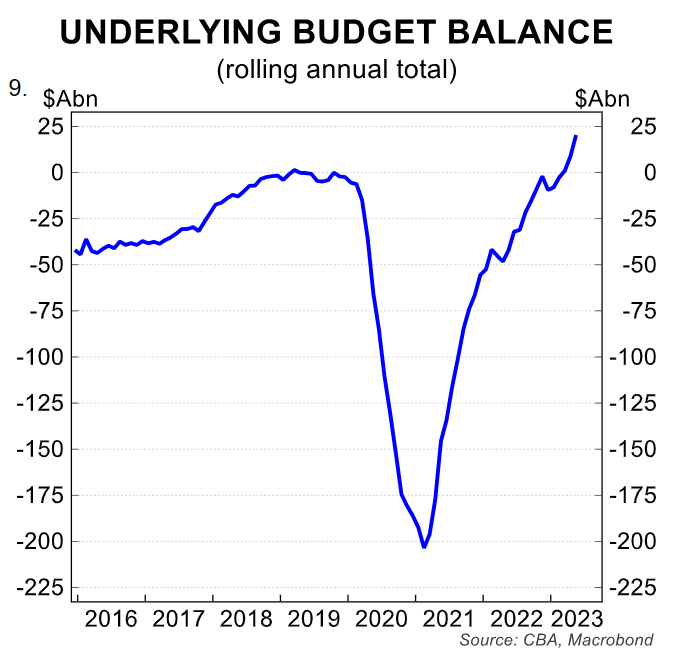
But most of the growth is coming through state government budgets which are more constrained. Together with capacity constraints, this does put near term spending at some slightrisk.
