The Australian Dream of owning a home is well and truly dead, according to PropTrack’s new housing affordability index.
PropTrack’s new index is built from household income across the whole distribution, and calculates what share of home sales they could afford to buy:
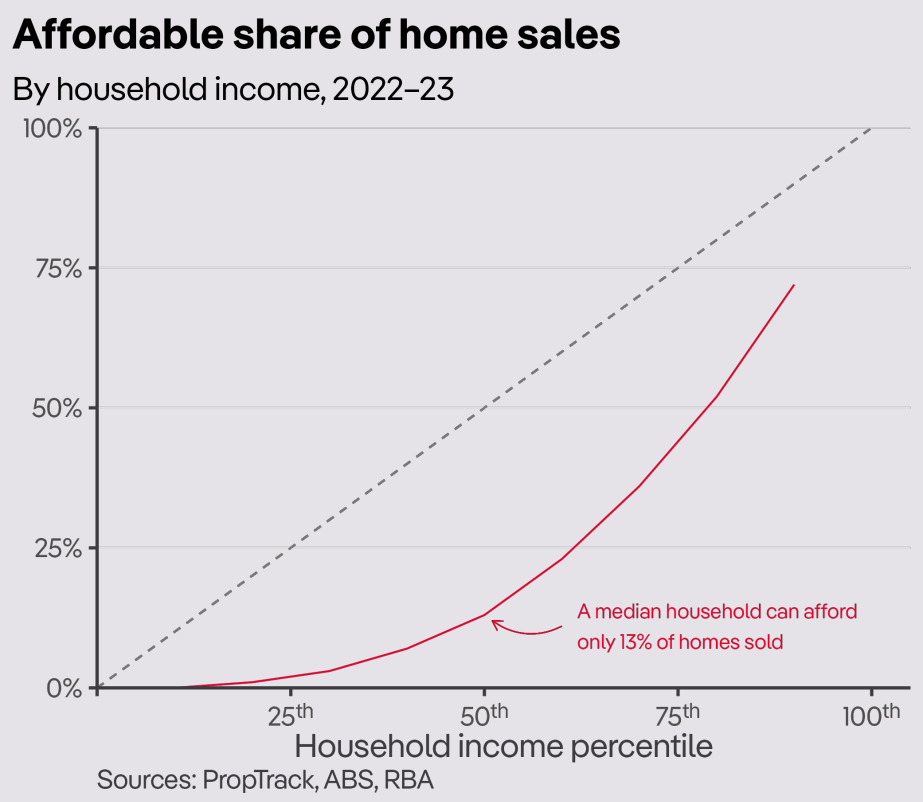
Shockingly, a median household earning just over $105,000 a year currently can only afford 13% of homes sold.
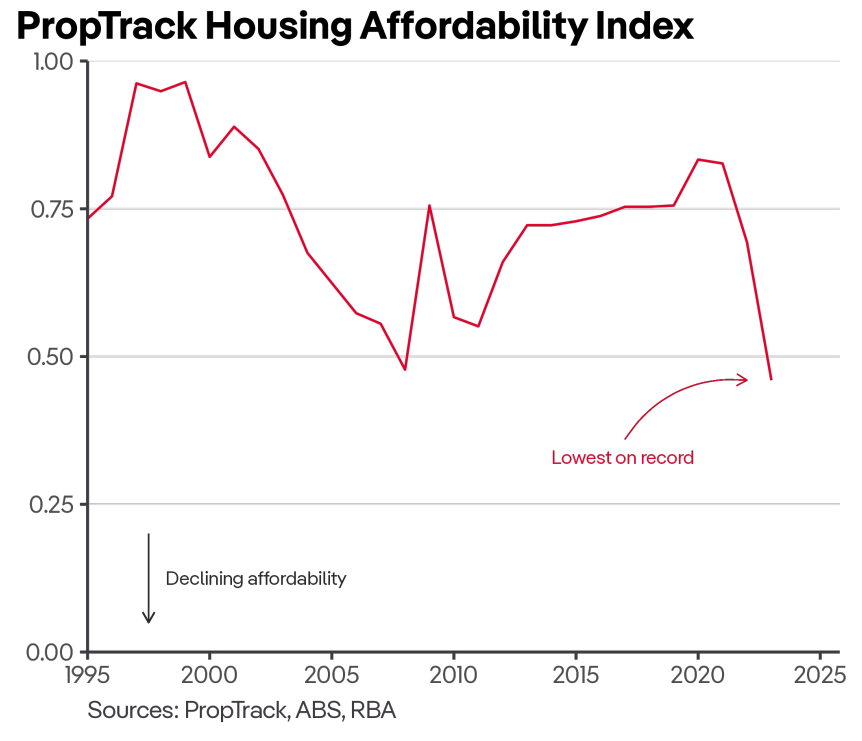
This is the worst result in records dating back to 1995:
Moreover, affordability has dropped massively from the mid-to-late 1990s when around half of all households on the median income could afford to purchase a home:
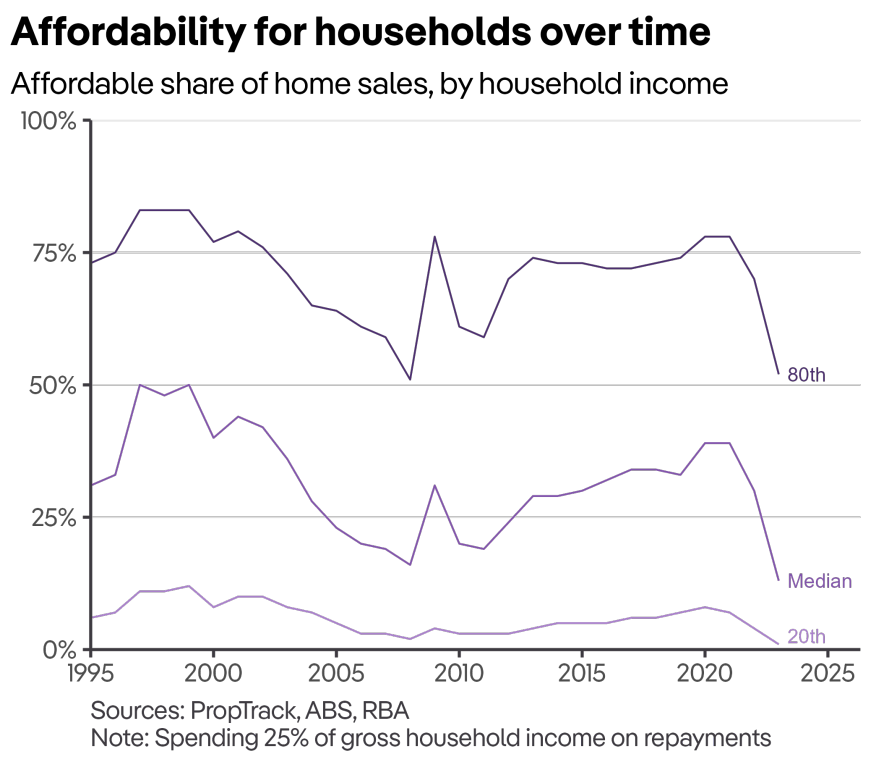
Even higher income earning households – i.e. earning more than $200,000 today – now struggle to afford a home, according to PropTrack.
As shown above, around 80% of households at the 80th percentile of earnings could afford a home in the mid-to-late 1990s. But today, only around half can.
“Rising household incomes since the pandemic following improved labour market conditions, which has drawn more people into employment and boosted wages growth, has been insufficient to offset higher home prices and, critically, the surge in mortgage rates”, PropTrack notes.
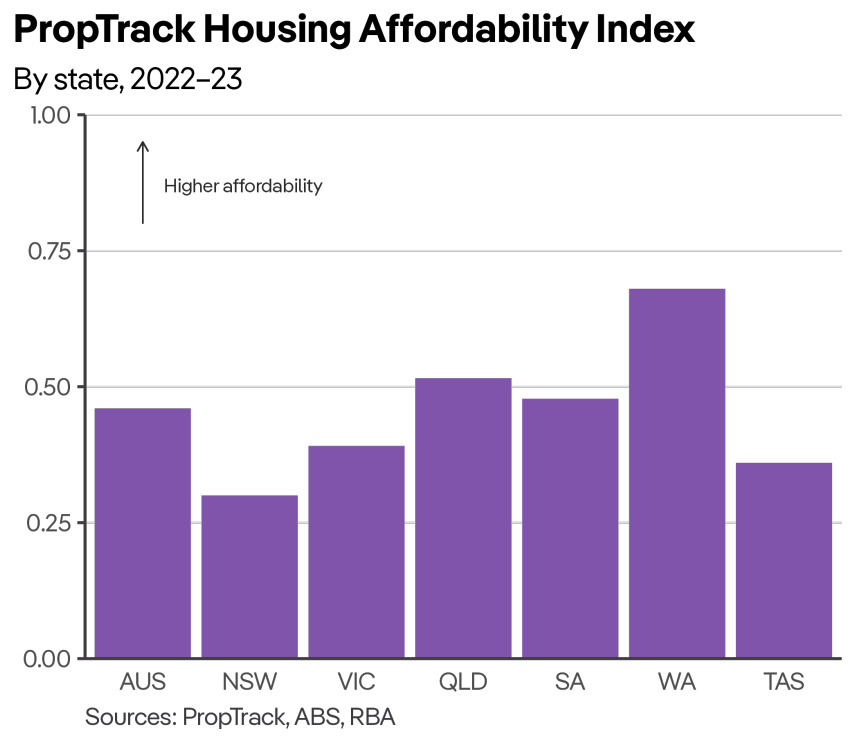
With a median home price exceeding $1 million in Sydney, New South Wales continues to rank as the least affordable state, as it has for most of the past three decades.
Victorian housing affordability remains below the national average and has recorded a significant deterioration over the past 12-18 months as interest rates have increased.
At the other end of the spectrum, housing affordability is highest in Western Australia owing to its relatively high incomes and lower home prices:
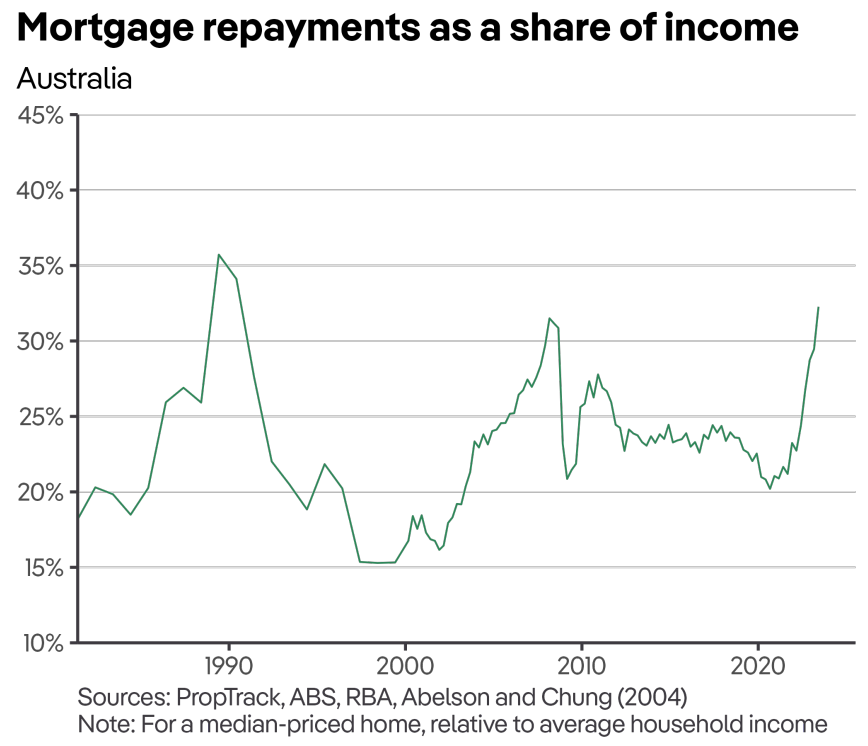
Mortgage repayments as a share of income are now tracking at their second highest level on record, behind the late 1980s and early-1990s when mortgage rates hit 17%:
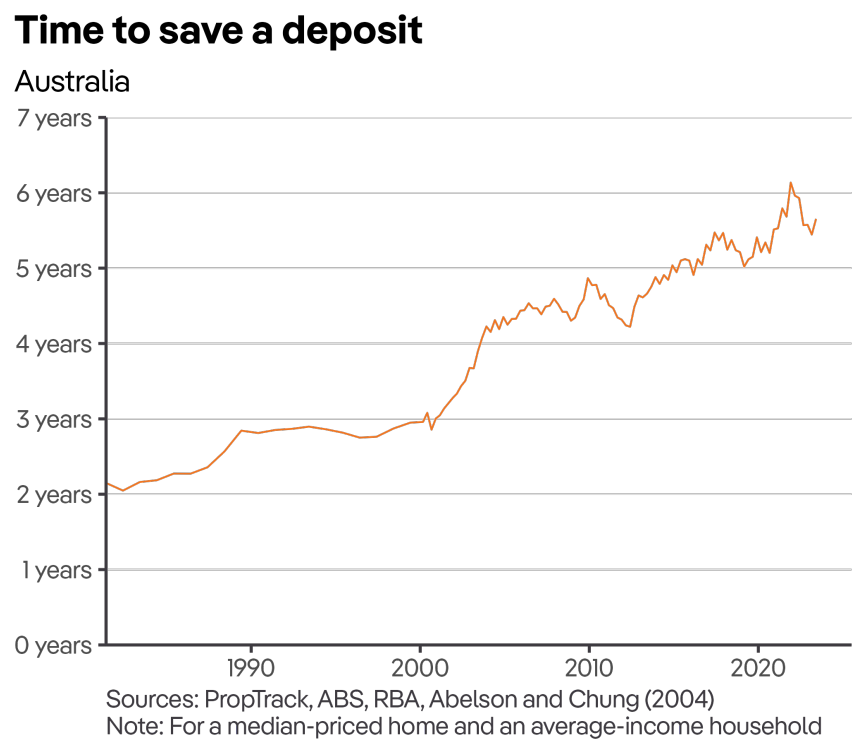
If mortgage serviceability wasn’t bad enough, the high price of homes means the amount of time taken to save a deposit is also tracking close to record levels.
Nationally, an average-income household would need to save 20% of their income for more than five and a half years to save a 20% deposit on a median priced home:
On Friday, the Housing Industry Association (HIA) released its housing affordability report, which showed that affordability has collapsed to its lowest level for 15 years.
“[This] highlights the alarming speed at which affordability deteriorated in just one quarter, with the Affordability Index falling by 8.7% nationally”, HIA senior economist, Tom Devitt said.
“Purchasing a home is the least affordable it has been since just before the GFC, 15 years ago”.
“Soaring mortgage rates and recovering dwelling prices mean that the average Australian income earner would now have to commit half of their income to the service of a typical new mortgage. In Sydney, they would have to commit more than two-thirds of their income”.
It is hard to see how the situation will turn around given the federal government’s mass immigration policy, which will forever ensure that housing demand runs ahead of supply.
The 2023 Intergenerational Report projected that Australia’s population would increase by 14.2 million in just 40 years on the back of extreme levels of immigration:
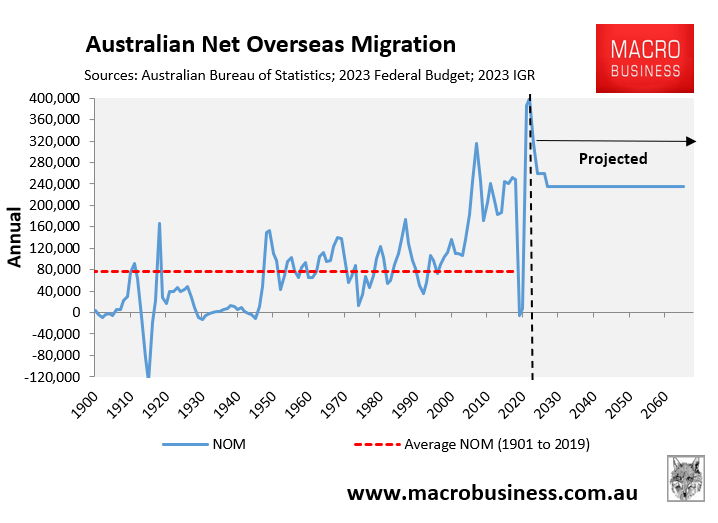
That is the equivalent of adding the combined populations of Sydney, Melbourne, Brisbane and Adelaide to Australia’s current population in only 40 years.
It will ensure that the Australian Dream of home ownership remains dead, buried and cremated.