Financial market economist and consultant to the stars, Gerard Minack, with the horrible truth about the Aussie population economy.
Australia doubles down on a dumb strategy
Australia’s economic performance in the decade before the pandemic was, on many measures, the worst in 60 years. Per capita GDP growth was low, productivity growth tepid, real wages were stagnant, and housing increasingly unaffordable. There were many reasons for the mess, but the most important was a giant capital-to-labour switch: Australia relied on increasing labour supply, rather than increasing investment, to drive growth. Remarkably, the country now seems to be doubling down on the same strategy.
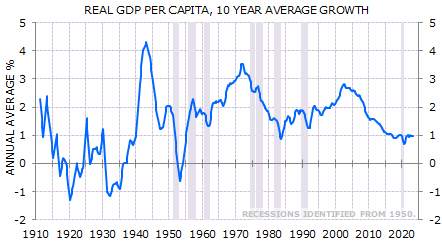
Australia has been in an extended low-growth rut for almost 20 years. Decade average per capita GDP growth has been around 1% since 2014, the worst performance since the early 1950s (Exhibit 1). (The weakness in the early 1950s was partly because the war boom dropped out of the data while the post-war demobilisation-driven decline remained in.)
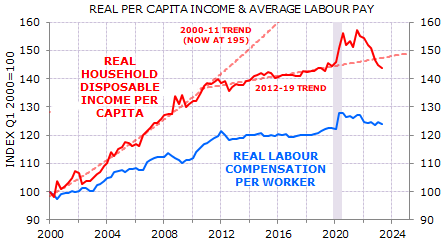
Weakness in per capita GDP has been matched by poor household income growth and poor labour pay. Incomes popped in the pandemic but are now below the weak pre-pandemic trend (Exhibit 2).
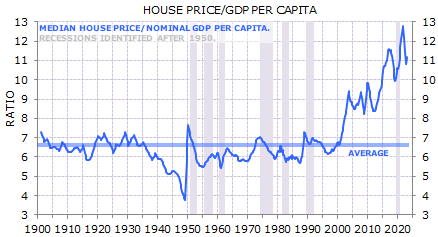
Inflation-adjusted income data understate cost of living problems. House prices are not included in consumer inflation measures. House prices have boomed since 2000, far out-pacing income growth (Exhibit 3). The result is a collapse in affordability and a significant increase in the real cost of housing, either as an owner or renter.
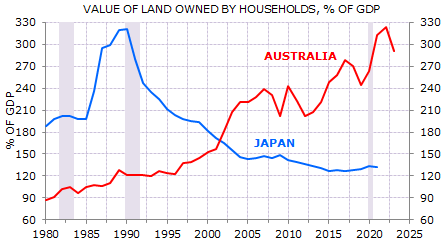
Japan famously introduced 100 year (aka ‘three generation’) mortgages at the top of its epic property bubble in the late 1980s. Australian land valuations have now inflated to match the peak of that Japan bubble (Exhibit 4).
Australia’s bloated residential market is having important effects on the real economy. High house prices are a factor in labour market mismatches as potential workers can often not afford homes near workplaces. Declining affordability has gone hand-in-hand with declining home ownership rates, particularly amongst older workers (Exhibit 5).

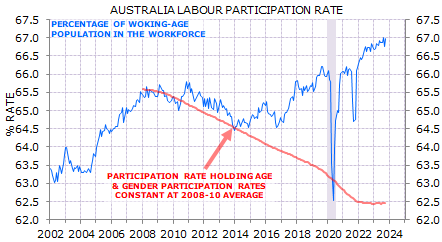
The prospect of pensioner penury probably explains why Australia’s labour participation rate is defying the demographic trends that have reduced participation in other developed economies (Exhibit 6). If you can’t afford to retire you won’t.
There are many factors behind the poor GDP growth, low productivity, stagnant wages, and increasingly unaffordable housing. But in my opinion the single most important driver has been a massive capital-to-labour switch: Australia has increasingly relied on increasing labour supply, rather than increasing investment, to drive growth.
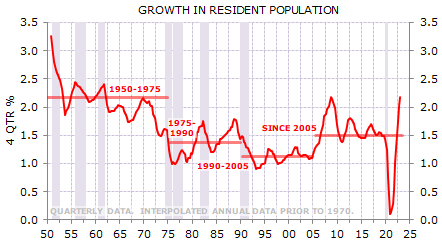
Population growth surged from 2005 and average growth since then has been the strongest since the post-war migration boom (Exhibit 7).
The impact of high population growth now is very different to the 1950s and 1960s. In the post-war boom workers were imported to join unionised workforces often protected from international competition. Now workers are pulled into a deregulated, largely de-unionised, workplace. The population growth in the 1950s and 1960s built cities that could sprawl on land that was cheap. Now land is expensive, and the extended sprawl is creating major negative externalities.
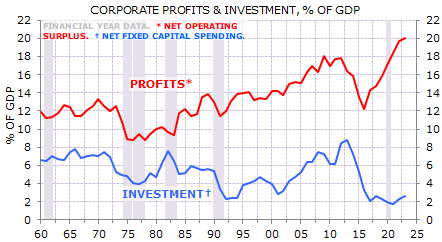
But most importantly, fast population growth in the post-war boom was accompanied by high investment. Over the past 15 years rising labour supply wasn’t accompanied by rising investment; instead, rising labour supply substituted for rising investment. Through the past decade non-mining investment has averaged levels only seen before at the nadir of the 1990s recession (Exhibit 8).

The decline in investment spending has occurred across the private and public sectors. The decline in business investment occurred despite record-low interest rates and record-high profits (Exhibit 9).
The capital-to-labour switch has been massively detrimental to living standards. To maintain living standards a country’s capital stock – assets such as schools, roads, hospitals, factories, offices, and housing – needs to match its population growth. Without that investment living standards fall. The Bureau of Statistics estimates that Australia’s capital stock is now around 330% of GDP. If population rises by 2%, then Australia needs to invest around 6.6% of GDP (2% of 330%) to maintain a steady capital stock per person. The capital stock now is bigger than in the 1950s. Consequently, the investment spending now required to maintain a steady per capita capital stock is higher than that required through the post-war migration boom (Exhibit 10).

A couple of points about this investment. First, it does add to GDP. This is not as good as many think. It is an example of the broken window fallacy. If a shopfront window is broken, GDP rises when the shop owner replaces the window. The fallacy is to assume that higher GDP increases living standards when in fact replacing a broken window only makes up for a loss not captured by GDP. The investment required because of population growth is the equivalent of replacing a smashed window. It doesn’t improve living standards: the investment makes up for losses not captured by GDP.
Second, the high population growth of the past 15 years has meant that almost all Australia’s investment spending has been the equivalent of replacing smashed windows. Exhibit 10 shows that Australia needed to invest just under 5% of GDP in order maintain a stable per capita capital stock through the past 15 years. Exhibit 8 shows that net investment spending is just over 6% of GDP. Barely 1% of GDP is being devoted to capital deepening (adding to capital stock per person).
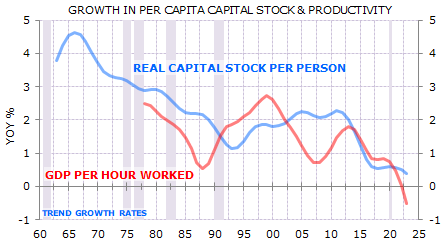
Capital deepening drives productivity. The switch to a population-led growth model has starved Australia of capital deepening investment. The result is declining productivity (Exhibit 11).
Australia’s population-led growth model was a demonstrable failure in the 15 years prior to the pandemic. Remarkably, the country now seems to be doubling down on the same strategy. The result, unsurprisingly, is likely to be more of the same.

