This month’s 0.25% hike in the official cash rate (OCR) by the Reserve Bank of Australia (RBA) has had an immediate impact on house prices, especially in Melbourne and Sydney.
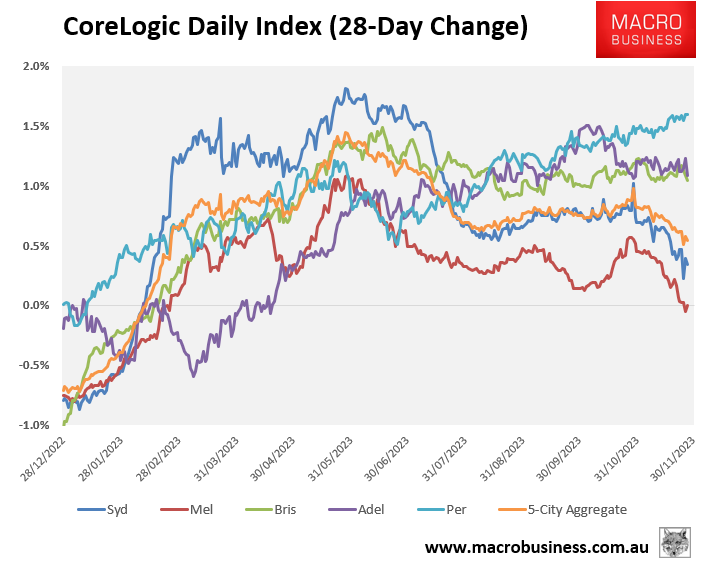
The next chart shows the 28-day rolling change in the CoreLogic Daily Dwelling Values Index, and shows a clear loss of momentum since rates were lifted on Melbourne Cup Day on 7 November:

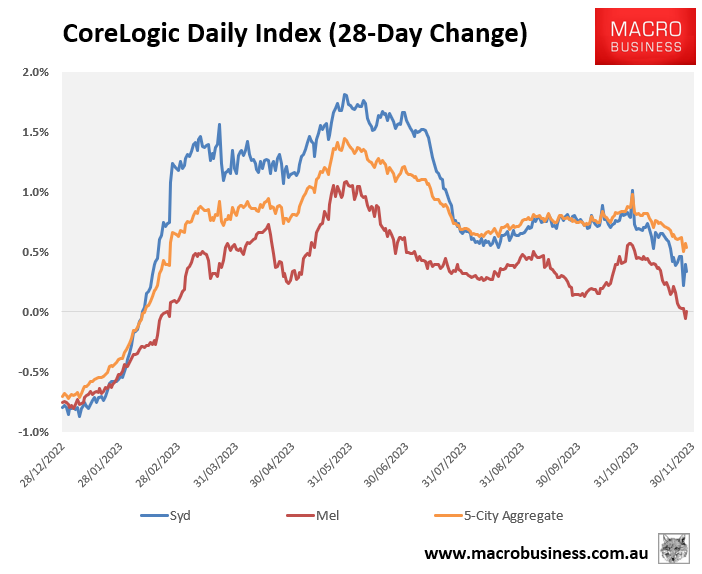
At the 5-city aggregate level, 28-day dwelling value growth has decelerated from 0.8% to 0.5%.
This deceleration has been driven by sharp slowdowns across Melbourne (from 0.4% to 0.0%) and Sydney (from 0.7% to 0.3%), whereas growth rates across the other major capital cities has been either stable (Brisbane and Adelaide) or accelerated slightly (Perth).
The next chart presents the same data across only Sydney, Melbourne, and the 5-city aggregate to remove some of the noise:

The slowdown in price growth has been matched by auction clearance rates, which have fallen over recent months.
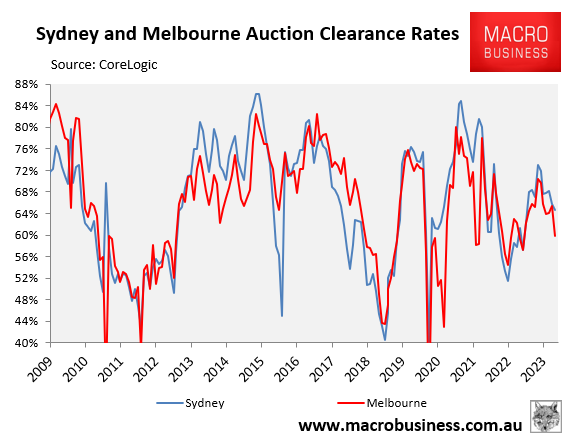
The below chart plots Sydney’s and Melbourne’s monthly average final auction clearance rates:

Sydney’s final auction clearance rate has fallen from a peak of 73% in May to 65% in November.
Melbourne’s final auction clearance rate has fallen more heavily, from 70% in May to 60% in November.
Last week’s preliminary capital city clearance rate also fell to just 65.9%, which was the lowest result since mid-March (65.0%).
Clearly the steam is coming out of Sydney and Melbourne house prices, which is also pulling values down nationally.
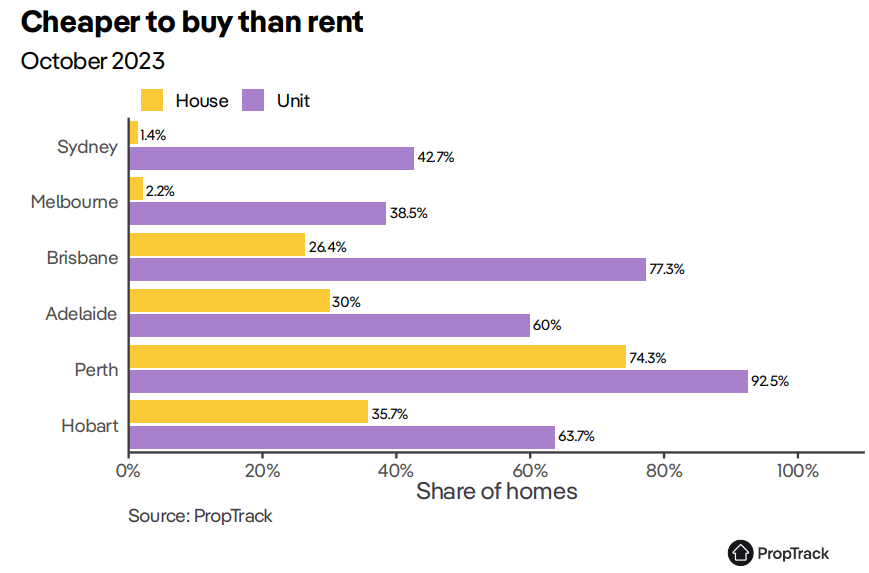
House prices in these two capital cities are the most expensive in the nation, which is also reflected in their price-to-rent ratios:

The record immigration volumes pouring into both cities are starting to be overwhelmed by the RBA’s aggressive monetary tightening and declining affordability.
If the RBA delivers another rate hike in February, it could usher in another house price correction centred on these two markets.

