New research from CBA shows that housing affordability for a household entering the market is the worst on record:
The charts represent an estimate of the percentage of a household’s pre-tax income that would be directed to servicing mortgage repayments for a newly purchased median-priced dwelling.
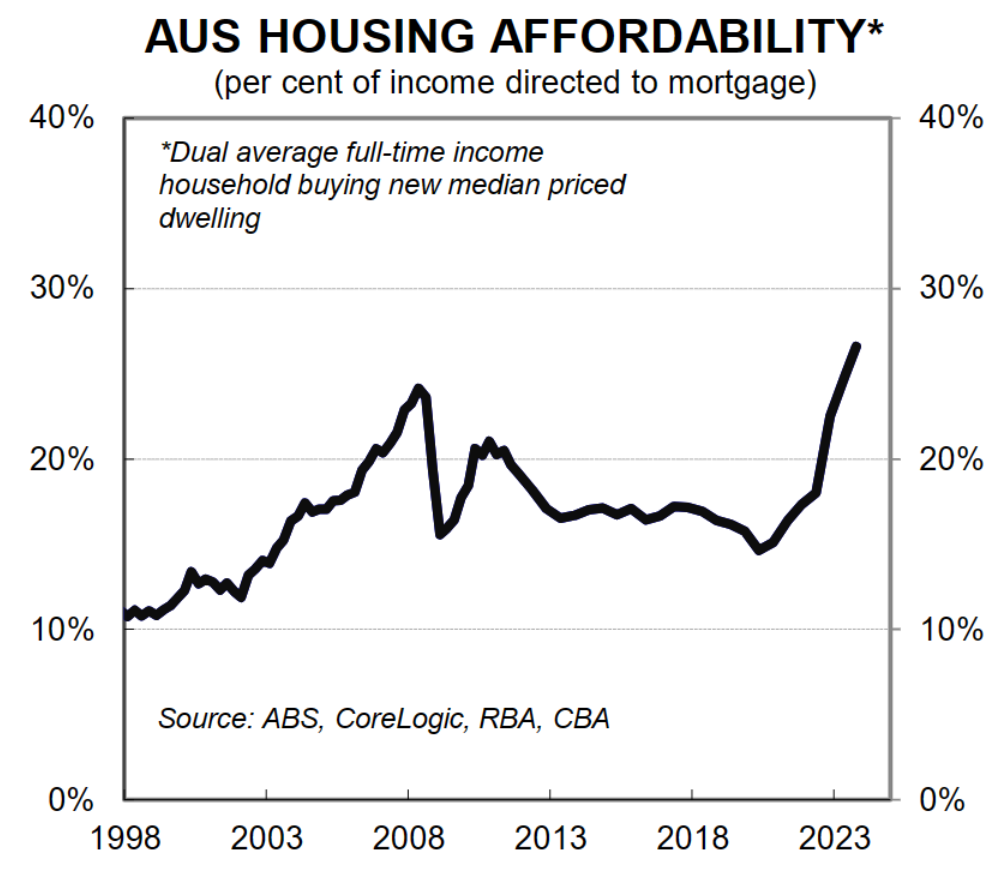
The household is assumed to contain two income earners who each receive average total full-time earnings, based on data from the ABS Average Weekly Earnings release.
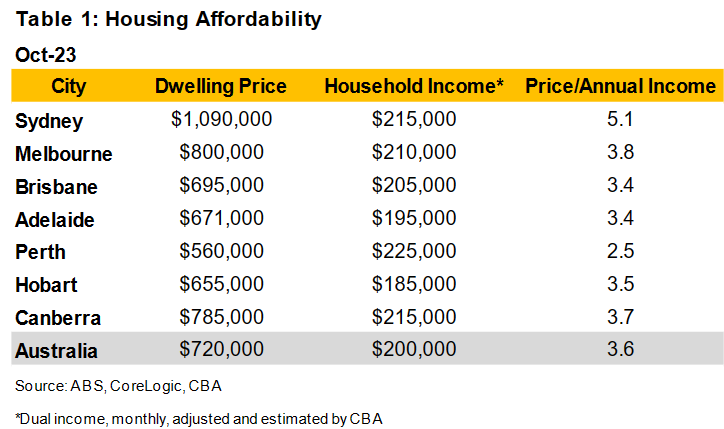
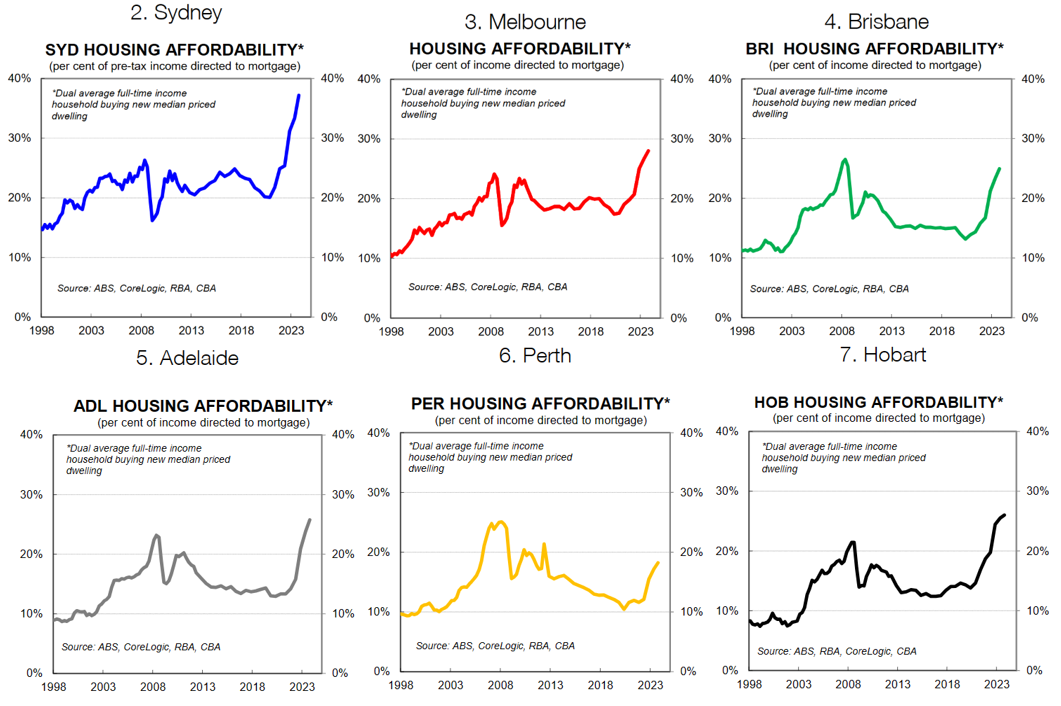
According to our analysis, mortgage repayments as a share of income are currently the least affordable in the history of our analysis in all cities except for Brisbane and Perth).
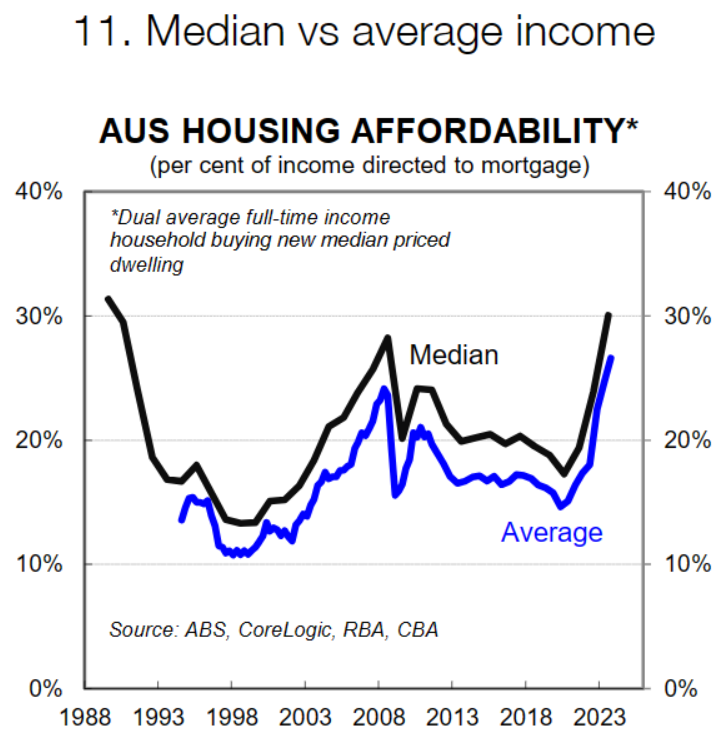
Median income data in the ABS employee earnings survey (which has a longer timer series) indicates repayments Australia-wide are approaching the levels seen in the late 1980’s when the standard variable rate peaked at 17% (chart 11).
Another angle to investigate housing affordability is estimate the maximum dwelling price that a household could afford based on a certain threshold.
Mortgage stress is often described as paying more than 30% of household income for mortgage payments and associated housing costs (AHURi).
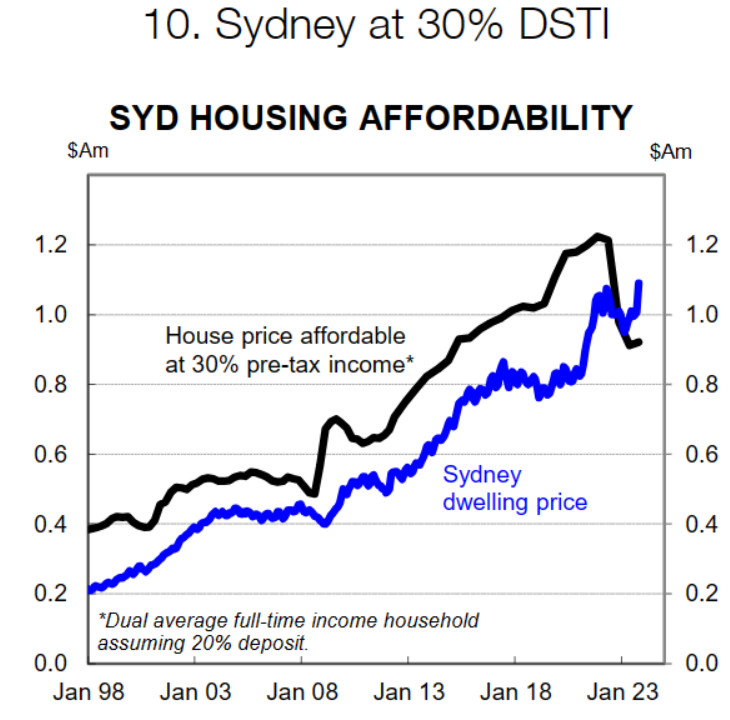
Using this metric in our calculations for Sydney reveals that median priced dwelling in the Harbour City exceeds this mortgage stress threshold for the first time (chart 10).
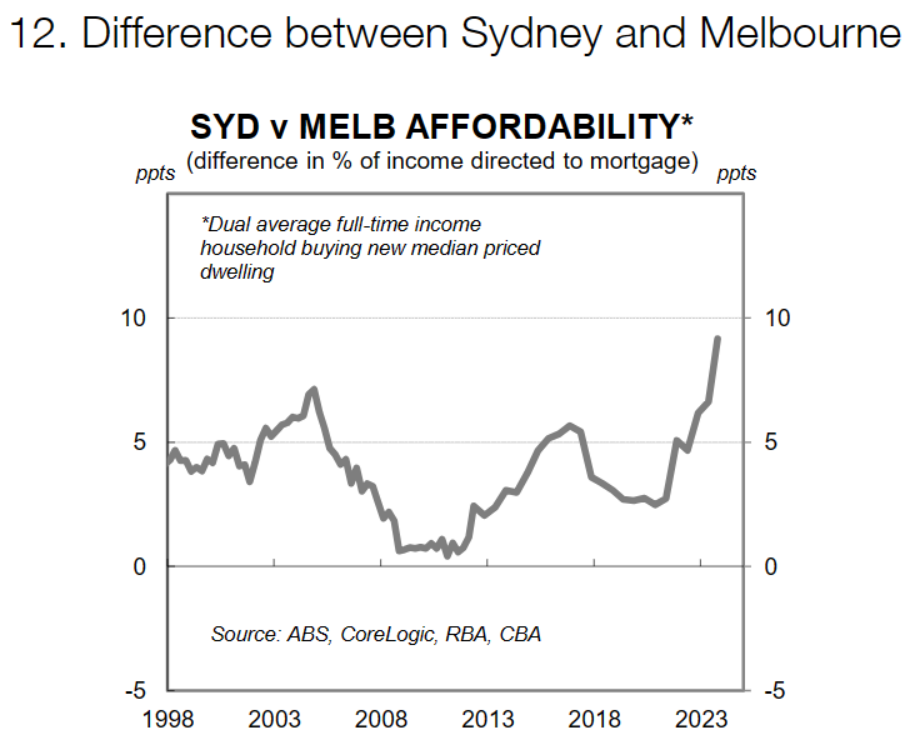
The difference between Australia’s two most populous and usually most unaffordable cities, Sydney and Melbourne, is now the largest now than it has been in this dataset (chart 12).
It is likely Sydney is approaching affordability constraints in terms of dwelling price growth. Our current dwelling price forecast for Sydney in 2024 is below that of the 8-capital city index.
It is important to note that a household that contains two full-time employees earning average total full-time earnings overstates the median Australian income.
The average weekly earnings data is used in this analysis as it is the most high-frequency dataset that suits the calculation. Average earnings are skewed higher by high incomes and as such using median incomes would result in measures of affordability looking even more challenging.
To illustrate, chart 11 includes less-frequent and more lagged data on median income to serve as comparison.
Further, many households rely on less than two full-time earners, adding to the affordability challenge.
Separate CBA data also shows that aggregate debt repayments as a share of aggregate household income is also the highest on record, and that is before Tuesday’s rate hike:
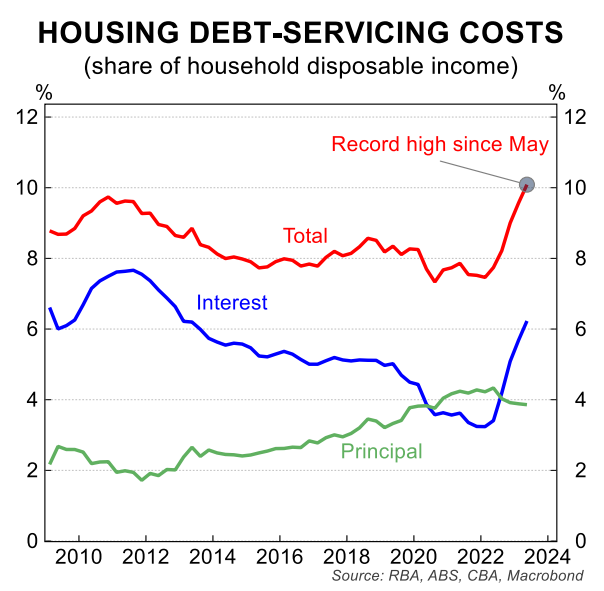
Therefore, existing mortgage holders are also being punished.

