With Australia’s population growing like a lab experiment via mass immigration, it needs ongoing strong infrastructure investment. Otherwise, it faces capital shallowing and lower productivity growth.
But strong infrastructure investment is also juicing domestic demand and inflationary pressures.
In the below note, CBA senior economist, Belinda Allen, explains the infrastructure conundrum facing Australian policy makers.
Key Points:
- The resilience of domestic demand hasled to both stronger inflation outcomes and upside risks to the inflation outlook.
- Public sector spending and private investment have been key drivers of domestic demand over the past year.
- Looking forward there are four main pipelines of investment work taking place–residential housing, non-mining business investment, public infrastructure and the renewable transition.
- The total pipeline is large at a time when capacity constraints, for labour, materials and financing are evident.
- A growing population and competing policy priorities mean shifting the pipeline of work will be challenging.
Domestic demand in 2023
Domestic demand has been stronger than expected in the Australian economy over the course of 2023.
Faster population growth has provided a tailwind to the economy through household spending. But outside household spending, domestic demand has been stronger than anticipated over the past year also.
Private business investment and public demand have been the key drivers. Attention has turned to the impact of this stronger domestic demand pulse on prices and interest rates.
In November, the Reserve Bank of Australia (RBA) expanded its reference to the demand pulse in the Australian economy from “trends in household spending” in October to “trends in domestic demand”.
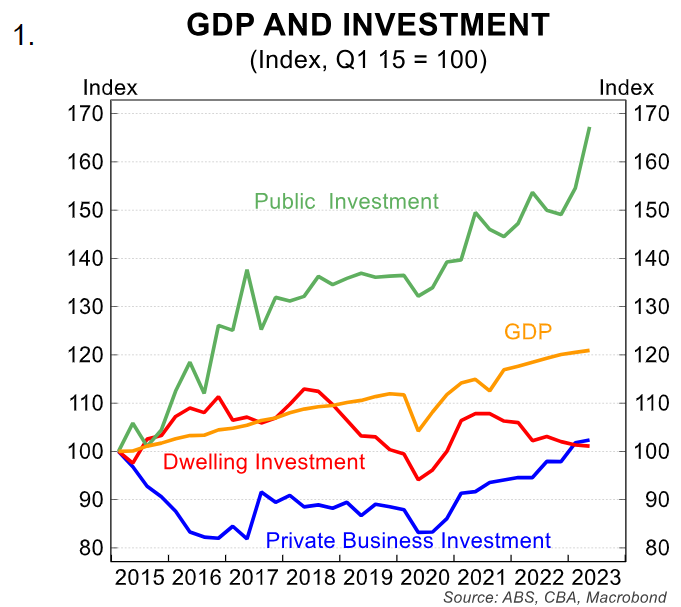
Over the year to June 2023, domestic final demand rose by 2.2% in volume terms, versus GDP of 2.1%. The fastest growing parts of domestic demand were public investment (8.8%/yr) and private business investment of 8.2%/yr.
In contrast household consumption rose by 1.4%/yr, and public spending by 1.4%/yr. In contrast dwelling investment fell by 14.2%/yr. For context these four parts of the economy are ~44 % of GDP.
Chart 1 shows the performance over recent years. The resilience in domestic demand has contributed to stronger than expected inflation.
The RBA in the November Board Meeting Minutes noted “higher inflation reflected demand pressures in the economy being stronger than had been expected”. This was followed up by hawkish commentary by Governor Bullock at a speech on22 November where she noted “the remaining inflation challenge we are dealing with is increasingly homegrown and demand driven”. And “a more substantial monetary policy tightening is the right response to inflation that results from aggregate demand exceeding the economy’s potential to meet that demand”.
The RBA in its Statement on Monetary Policy through its liaison program noted “Construction of government infrastructure projects has also contributed to the resilience in overall economic activity, with demand continuing to exceed available capacity in the sector …. Some firms report the need to compete with infrastructure projects for materials and labour inputs. Looking forward the pipeline of non-residential investment projects remains large, both from the public and private sector.
Elevated inflation, restrictive interest rates and a shortage of housing has sparked discussions about the implications of this work. In the rest of this note we detail how the economy got to this point, the size of the various pipelines of work and implications.
How did we get here?
It was in the late 2010s that the need for a stronger investment pipeline, both from the public sector for critical infrastructure, and the private sector through non-mining investment was the focus.
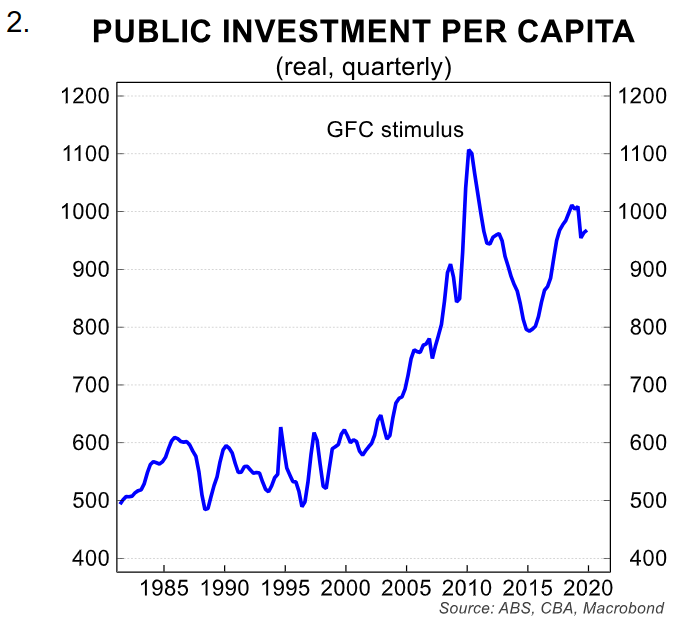
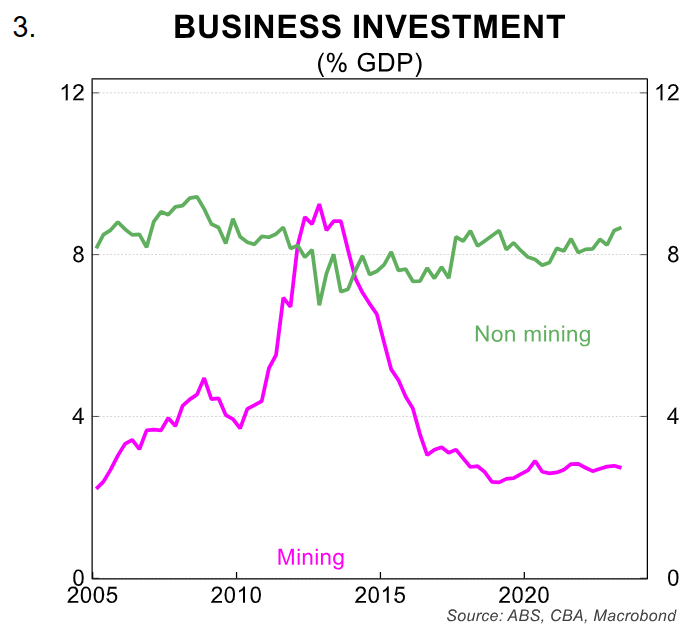
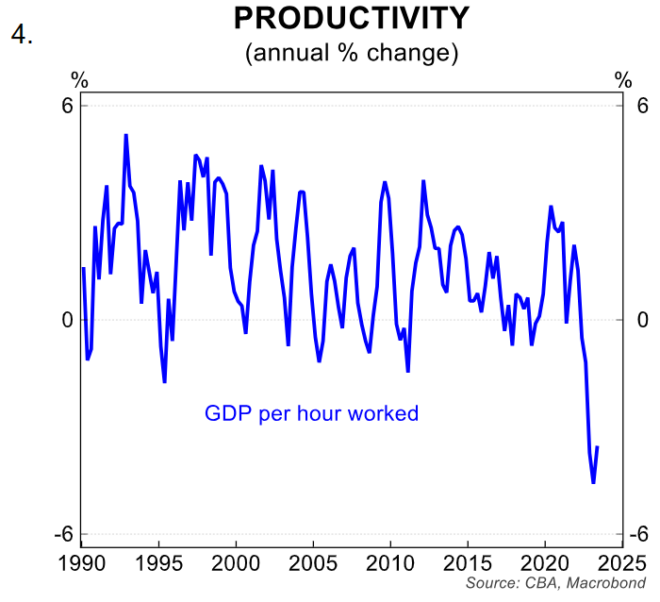
Public investment per capita had fallen post GFC induced spending (chart 2). Business investment as a share of GDP, particularly for non-mining investment was faltering (chart 3) and productivity growth was slowing (chart 4).
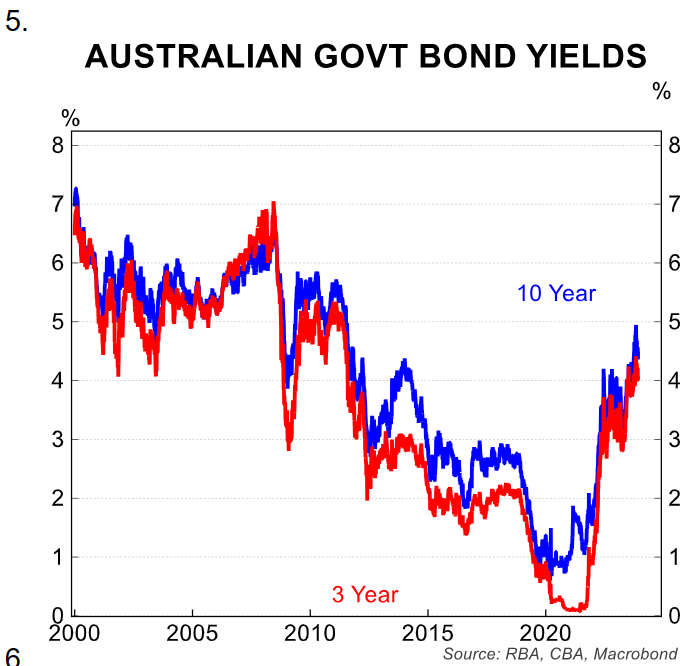
Australia was dealing with an ageing, less efficient stock of infrastructure. And bond yields had been falling given a low inflation environment (chart 5).
A growing population required more infrastructure, particularly in the transport sector. While stronger business investment, together with that expansion in the infrastructure stock would also improve productivity growth. And with the economy operating with some spare capacity pre pandemic, and interest rates at low levels it was an easier policy to advocate for.
Although even back then there were concerns raised about the economy’s capacity to deliver large projects. Since then, public sector infrastructure pipelines have expanded and significant investment work has been completed by both the private and public sector.
As we note later in the report, public capex and non-mining investment intentions have risen again in 2023/24. Bond yields have also risen to the highest level of 10 years.
The cost of financing projects is higher meaning the cost benefit analysis of some projects would have shifted. Capacity constraints in the economy are now evident, particularly in the construction industry.
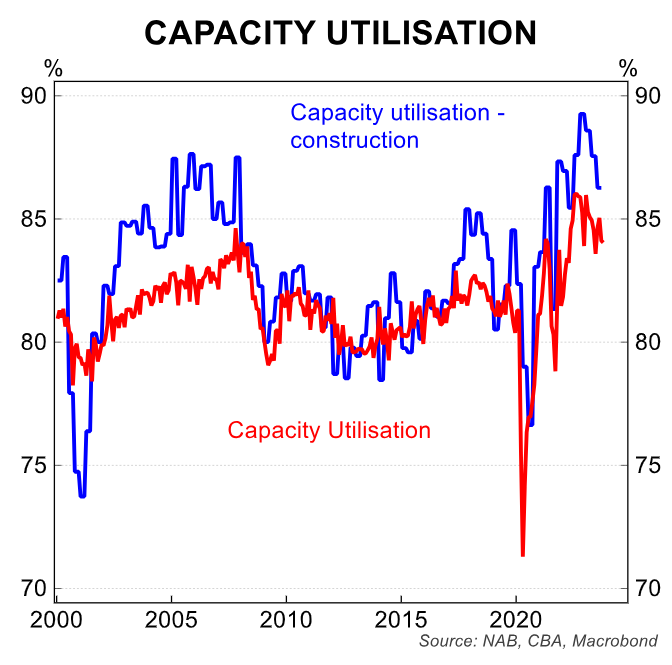
Capacity utilisation now sits at 84% for the economy and 86% for the construction sector, compared to ~82% for both in mid 2019 (chart 6).
Add to this the labour market is significantly tighter compared to 2019 with the unemployment rate sitting at 3.7% in October compared to above 5% in 2019.
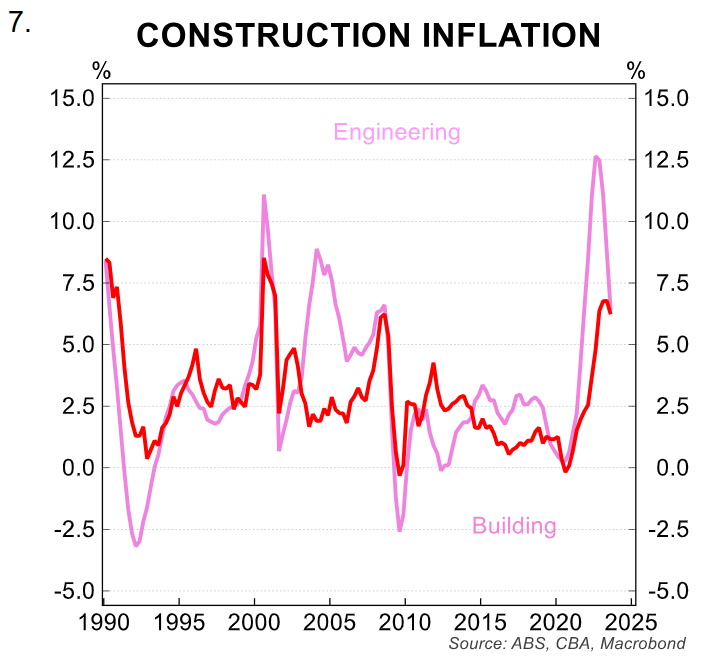
Cost pressures are also evident. Construction inflation for building and engineering work remains elevated, albeit off the peak pace of growth reached in 2H 22 (chart 7).
Much of this has been driven by material prices including steel, timber, ceramic products, other metal products, plumbing products and cement.
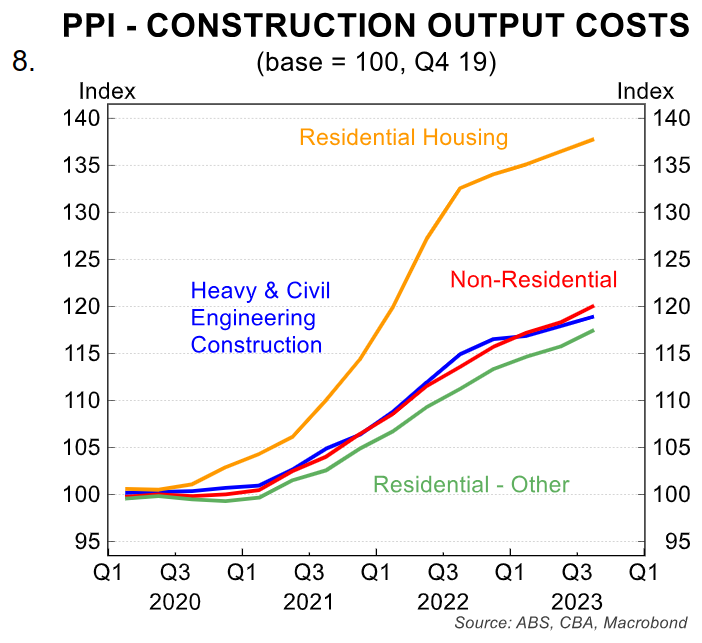
As chart 8 shows since the start of the pandemic output costs for residential housing have risen significantly more than other construction work. Labour costs are also playing a large role.
Job vacancies remain elevated for construction workers and engineers, while wages growth for the construction industry has outpaced the broader market at 4.3%/yr compared to 4.0%/yr to Q3 23.
As we note later in the report for large public capex projects, labour costs account for a little more than 50% of project costs.
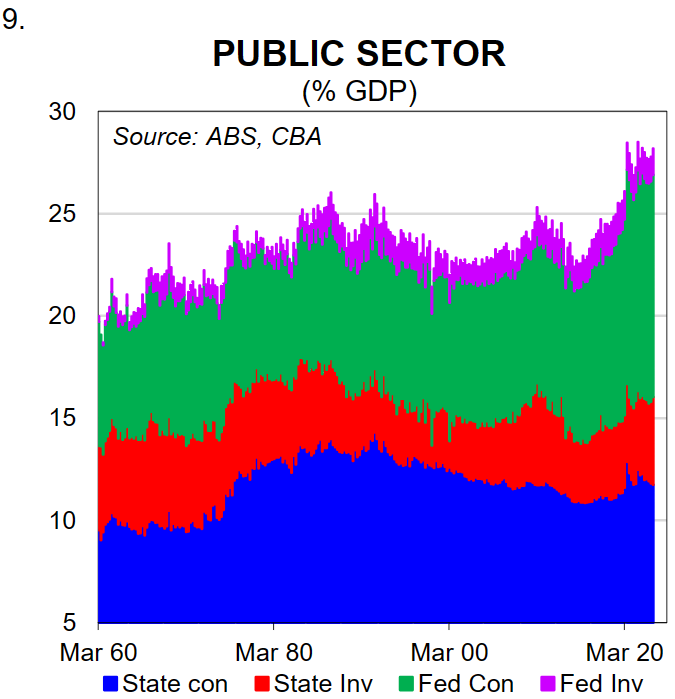
Adding to capacity constraints is rising recurrent government spending on health, aged care and the NDIS. As a result the government share of Australia’s economy has risen and sits at just over 28% of GDP as at Q2 23 (chart 9).
The Federal government has undertaken an independent review of the public capex pipeline in response to bottle necks and cost blow outs.
Cost inflation throughout engineering, building and construction work remains elevated compared to pre pandemic.
The RBA as noted above details crowding out behaviour and competition for resources. But as we note below when we look at the pipeline of activity over coming years there is little respite.
Current pipelines of work:
Residential housing
As we have noted in various publications, there is a large under supply of housing in Australia. Rental vacancy rates are at around record lows, building approvals are running at close to decade low levels and demand for housing is growing due to strong population growth.
The Federal government is targeting the build of 1.2mn homes over the five years starting July 2024. This equates to 240,000 dwellings per year and would have to see a significant lift from around the 160,000 level of current completions.
High costs, labour shortages, profitability issues and insolvency issues are impacting the industry. There is ongoing debate about where, what and how to expand the supply of housing.
The NSW government has recently nominated locations for an increase in housing density as well as targets for each region, much of this appears to be in existing areas with infrastructure capacity already in place.
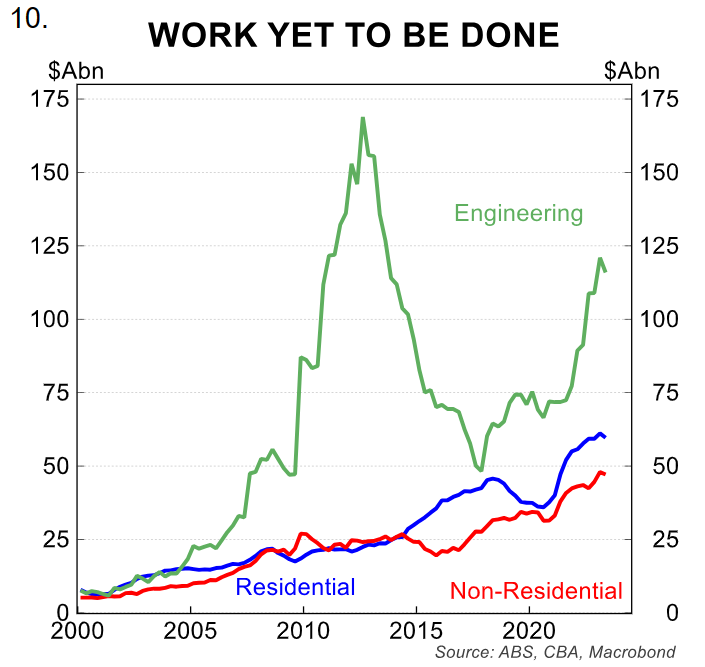
Currently the value of residential work in the pipeline is $A75bn, this includes both work not yet commenced ($A16bn) and yet to be completed ($A59bn), close to a record high.
To meet policy targets the pipeline will need to be increased and would require coordination through every stage of the development and construction process.
As well as extra capacity and resource allocation of labour and materials. Construction companies continue to be challenged with insolvencies due to a high cost base.
Business investment pipeline
The outlook remains strong for private business investment. According to the Q323 capex survey, implied investment plans total $A180bn for mining and non-mining sectors in 2023/24, which would mark a new record high for the series in nominal dollars.
For context $A165bn of work was completed in 2022/23. The growth has primarily come in the non-mining sector with the growth over the first half of 2023 the strongest since 2007.
An easing of supply chain disruptions has boosted purchases of plant & equipment, including vehicles. There has also been growth in non-residential construction investment and the pipeline of work.
However as noted earlier private business surveys suggest capacity constraints, flowing from the large amount of public capex work is leading to cost pressures for materials and contractors.
Public capex pipeline
We published our latest report on the public capex pipeline in July. Since then the NSW Budget was released and the pipeline for 2023/24 including both Federal and state governments totals $A119.6bn.
This is a 6.5% lift on the prior financial year in nominal dollars. For state governments the pipeline continues to grow the following year and is expected to be at its largest in 2024/25vat $A91.9bn (chart 11).
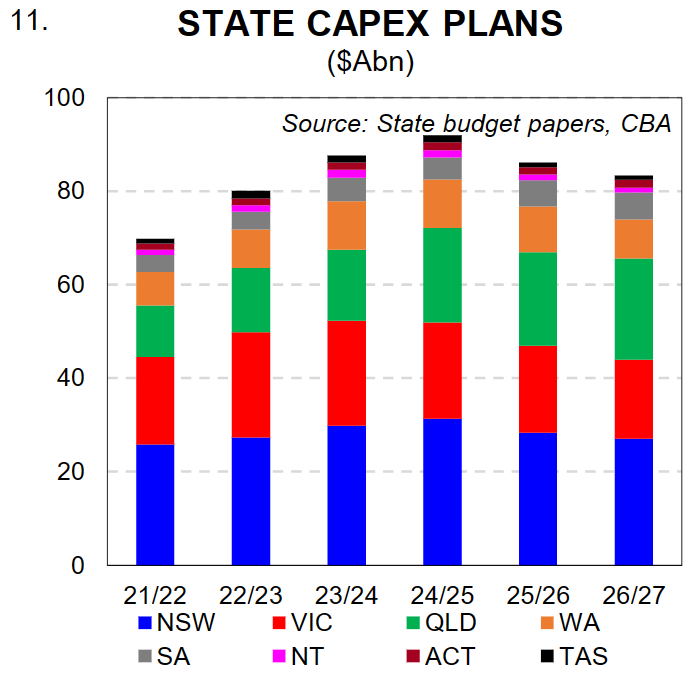
A number of large transport projects are expected to conclude around this time. Since we published this report, the Federal Government conducted an independent review into the pipeline with the details released in mid-November.
Some projects have had funding removed, the funding process has changed and other projects have had funding lifted due to cost escalation.
Overall though, we do not expect any significant changes in the shape and size of the public capex pipeline in the short term and the impact on the immediate inflation pulse.
There has also been recent commentary by the International Monetary Fund “the Commonwealth Government and state and territory governments should implement public investment projects at a more measured and coordinated pace, given supply constraints, to alleviate inflationary pressures and support the RBA’s disinflation efforts. Otherwise, interest rates would have to be even higher, putting the burden of adjustment disproportionately on mortgage holders”.
Investment to meet Australia’s renewable transition
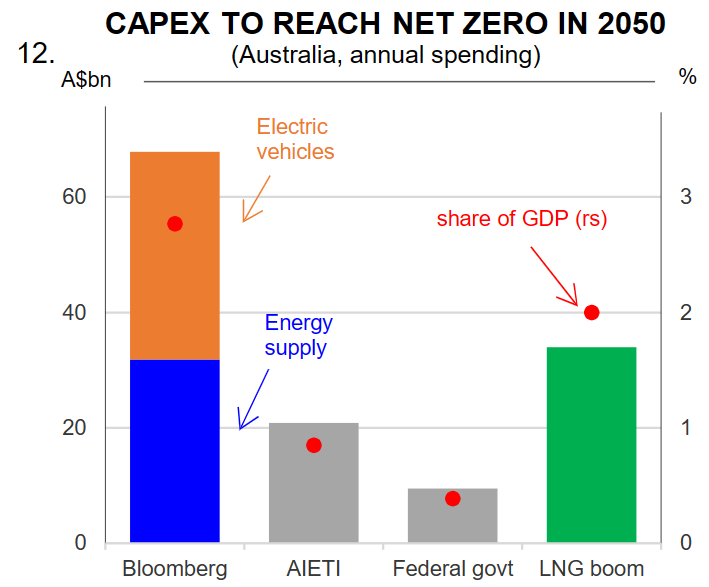
Australia will also need to undertake an investment program as part of the transition to renewable energy and to meet climate goals. Estimates put the required capex at around $A26bn per year until 2050.
This again will add to the total capex pipeline and inflation pressure. See chart 12 for various estimates.
In addition the transition to renewable energy is expected to add to electricity and energy prices and the volatility of these. But ultimately, over time prices should be lower as the transition evolves.
How much is too much investment?
Australia’s investment pipeline is large in context of history. Both private and public sector investment is at or close to record highs (excluding the mining investment boom).
The peak is still a year or two away, although the clear risk is the cycle is elongated given resourcing and cost constraints as well as the recent Federal Government infrastructure review.
Some state projects may also be cancelled as new cost estimates no longer pass cost benefit analysis due to rising costs, interest rates and appetite.
Judging how much investment is too much is challenging. A growing population requires (and also justifies) higher investment and in the long run investment boosts productivity and lowers inflation.
However current metrics such as inflation, capacity utilisation and feedback from the industry suggests a prioritisation of projects is required.
That said, the politics of cancelling already announced projects is difficult, A lift in dwelling supply would alleviate pressures on the housing market and prices for existing and rental properties.
A significant lift in the supply of housing would require a diversion of resources away from other capex projects. And feedback from many industry participants note there are other challenges beyond resourcing holding back supply.
This includes development approvals, financing and suitable land. Large capex projects already underway are not easy to unwind in the short term given they run for multiple years. And Australia has legislated targets on its climate change ambition that will require capex to meet.
Private business investment could be the segment that is most subject to change. Higher interest rates and slowing consumer demand could impact this segment.
The 4th estimate of capex intentions for 2023/24 showed the implied nominal capex profile is $A180bn. Investment ratios as a share of GDP (chart 13) indicate Australia is ahead of peer economies (apart from NZ) on this ratio, but below the peak seen in the mining boom.
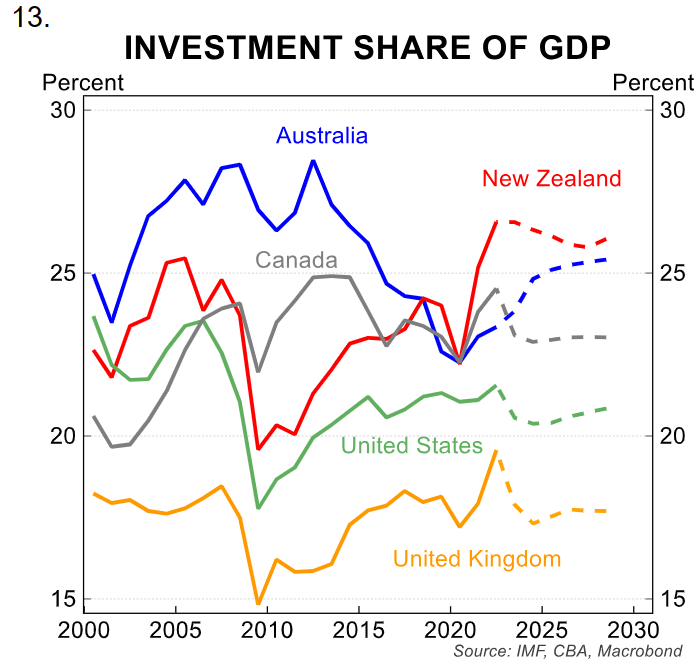
It is important to note that a lot of the capital, both physical and financial required during the mining investment boom was imported.
There is an element to this now, but as the construction share of employment indicates, the labour intensity is higher.
Infrastructure Australia in a 2022 piece notes one key issue has been rising insolvencies in the construction industry has reduced the number of companies able to deliver large scale complex projects. This reduces the industry’s ability to deliver projects.
And as at October 2022 there was an estimated shortage of 214k skilled workers, with demand for labour set to continue in 2023 and beyond.
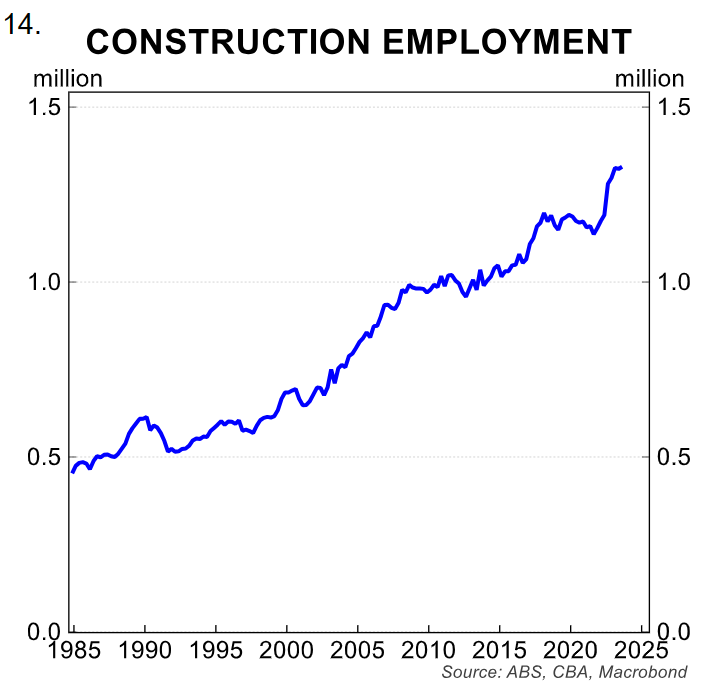
As chart 14 shows the total number of construction workers is close to a record high. The share of construction employment is also close to a record high Construction captures the end to end work includes everything from building, engineering and construction services jobs.
Infrastructure Australia notes labour is the largest share of expenditure for major public infrastructure activity at 56%.
Metrics such as public capex as a share of Gross State Product, or per capita can also provide colour on the comparable size of infrastructure spend in each state.
Data from the Parliamentary Budget Office indicates NT is at the top of the table for both. This is no surprise given the size of the state, the small nature of the population and the larger share of the government in the economy. See chart 15.
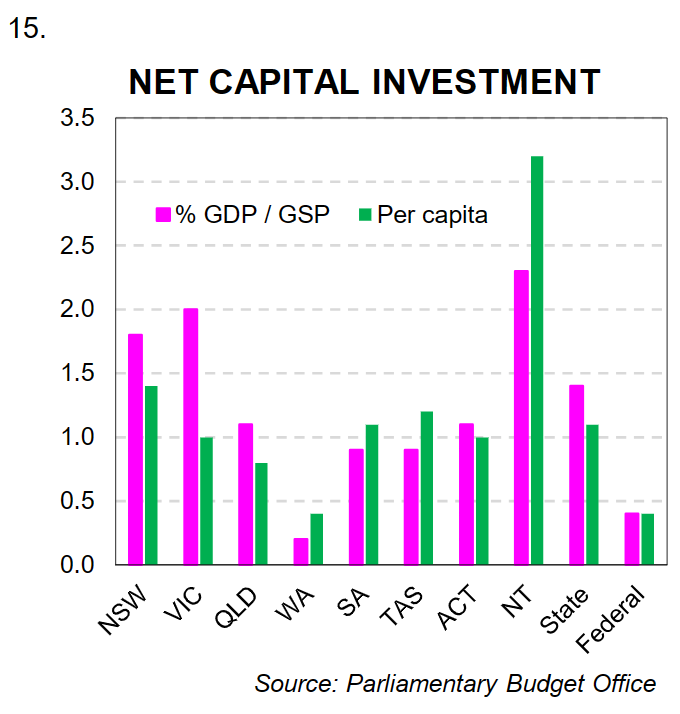
NSW and Vic rank highly as a share of GDP, and NSW also ranks highly on a per capita basis. WA is lagging on both metrics. A time series of data shows that all states have seen a rise in both metrics in recent years, with more to come.
The elevated and sustained pipeline in combination with rising work in other areas post pandemic has led to the capacity constraints and cost pressures evident in the industry.
The Australian economy is operating very close to capacity leading to elevated price pressures that are showing signs of being domestically driven.
The estimated pipeline of work for 2023/24 is currently at ~$A375bn (the sum of residential, public and private capex). Some state budgets are under pressure, particularly in comparison with the Federal position.
We could see some pull back of state government capex, particularly given projects will need to be re costed due to pricing pressure).
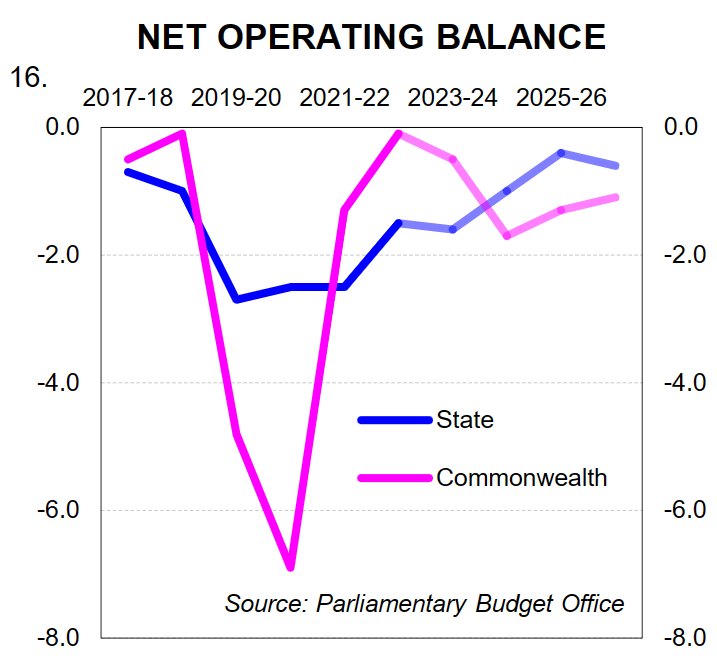
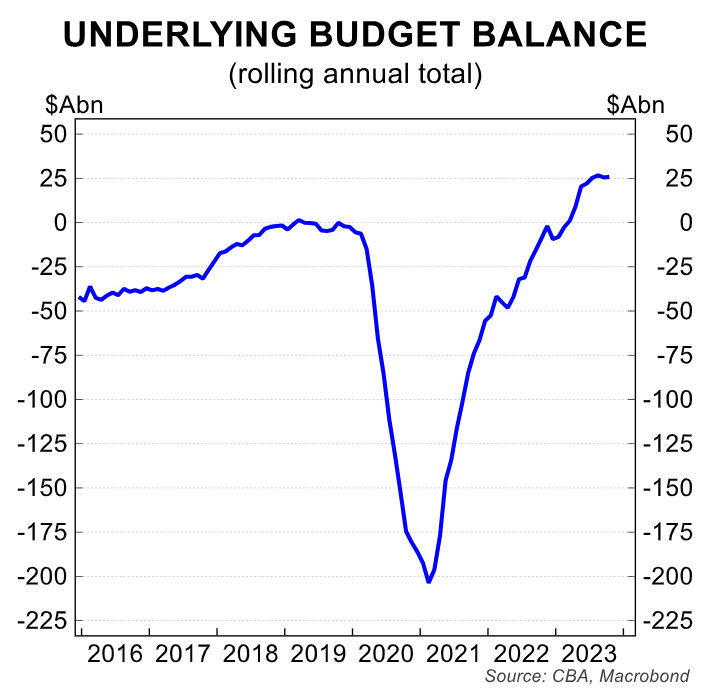
Otherwise a lift in capex profiles will add to state budget expenses and deficits (chart 16 and chart 17 for the Federal Budget monthly profile).
Conclusion
The domestic demand impulse outside of the consumer has been stronger than we had anticipated in 2023, particularly due to public and private investment.
The forward looking indicators suggest it will continue at elevated levels for the next year or so. There is the possibility that price pressures and capacity constraints do see some projects and investment cut, but there are limited signs of this currently.
The consumer currently is winding back spending on a per capita basis, impacted by higher interest rate and cost of living pressures, helping to close the gap between aggregate supply and demand.
This is cooling overall inflation, as well as disinflation in goods prices (as has been the experience globally).
However, given the RBA’s low tolerance for slippage of inflation, and still capacity constraints in the economy some form of policy prioritisation could be in order to help manage the price impact on the Australian economy.

