CBA Senior Economist and Senior Currency Strategist, Kristina Clifton, has published research estimating the amount of capital expenditures needed for Australia to transition to ‘net zero’ carbon emissions.
Clifton estimates that Australia will need to spend over $100 billion a year until 2050 to decarbonise energy and transport.
This scale of capital spending will add to demand and inflation pressures in the economy.
Australia also needs to prepare for higher and more volatile energy prices over the transition.
Capex to make the transition to net zero will add to demand:
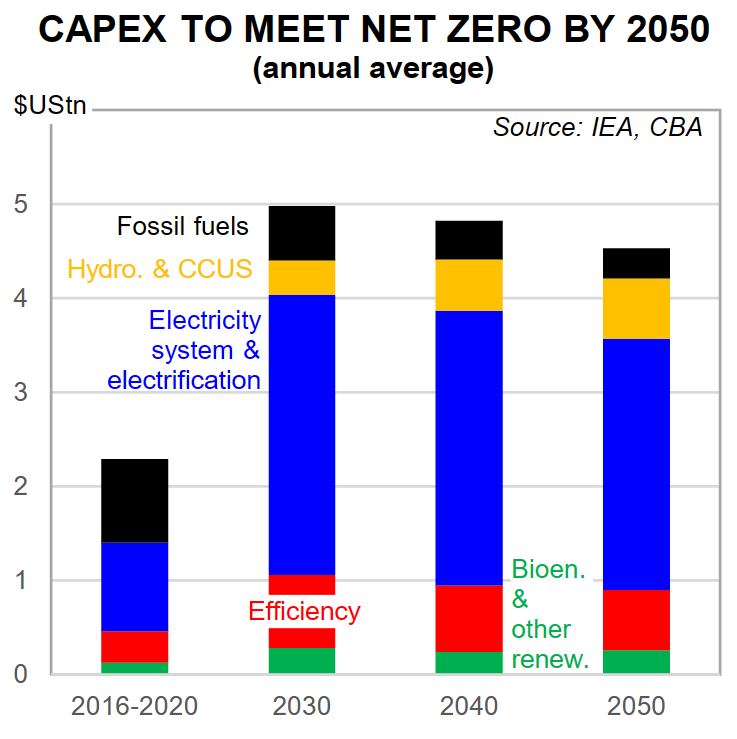
The International Energy Agency estimates that the world will need to double annual capex for the next three decades to build the equipment and structures need to meet the net zero emissions target by 2050 (chart 1).
Meeting Australia’s climate goals will also involve a large amount of capital spending. However, estimates on how much capex spending will be required vary widely.
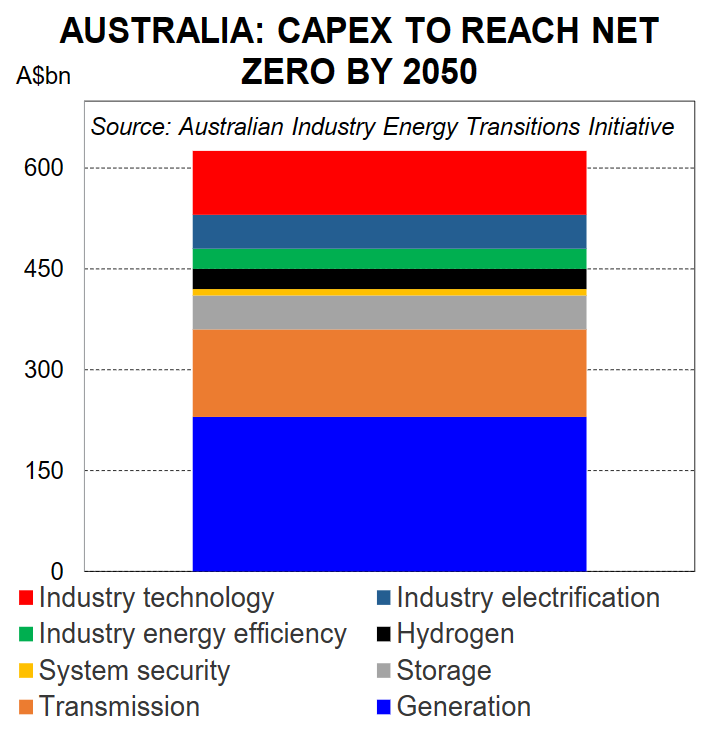
The Australian Industry Energy Transitions Initiative estimates that to meet the net zero emissions goal Australia will need around $A625bn of capex by 2050 to decarbonise Australia’s industry and energy system.
This averages out to around $A21bn per year until 2050. This estimate is limited as it only includes the actions to decarbonise five key industrial sectors: iron and steel, aluminium, other metals (copper, nickel, zinc and lithium), chemicals and liquefied natural gas (LNG).
Spending on new electricity generation, electricity storage, electricity transmission and new industry technology is estimated to make up the bulk of spending required (chart 2).
Bloomberg NEF estimates that around $A3 trillion ($US1.9 trillion) of investment is required to meet Australia’s 2050 net zero target. This averages out to a substantial $A104bn per year.
This spending can be broadly split into two categories: energy supply and energy demand. Energy supply captures spending on new renewable energy sources like wind and solar, the grid (transmission and distribution), heat pumps, carbon capture and storage and hydrogen.
Bloomberg NEF puts the required spending on energy supply by 2050 at $A1,400bn. This averages out to around $49bn per year.
Energy demand captures the spending required for electric vehicles. Around $A1,580bn of spending is required by 2050 to reach the net zero goal, or around $A55bn per year on average.
However, not all of this is “new” demand because worn out internal combustion engine (ICE) vehicles can be replaced with new electric vehicles, rather than being replaced with new ICE vehicles.
The Australian Federal Government announced a range of policies to stimulate around $A76bn of additional spending to help reach its goal of cutting emissions by 43% by 2030. This equates to around $A9.5bn per year.
Chart 3 presents these capex estimates as a share of 2022 GDP and compared to Australia’s LNG boom. Bloomberg NEF estimates, including both spending on energy supply and energy demand, equates to 4.3% of 2022 GDP per year over the next 30+years.
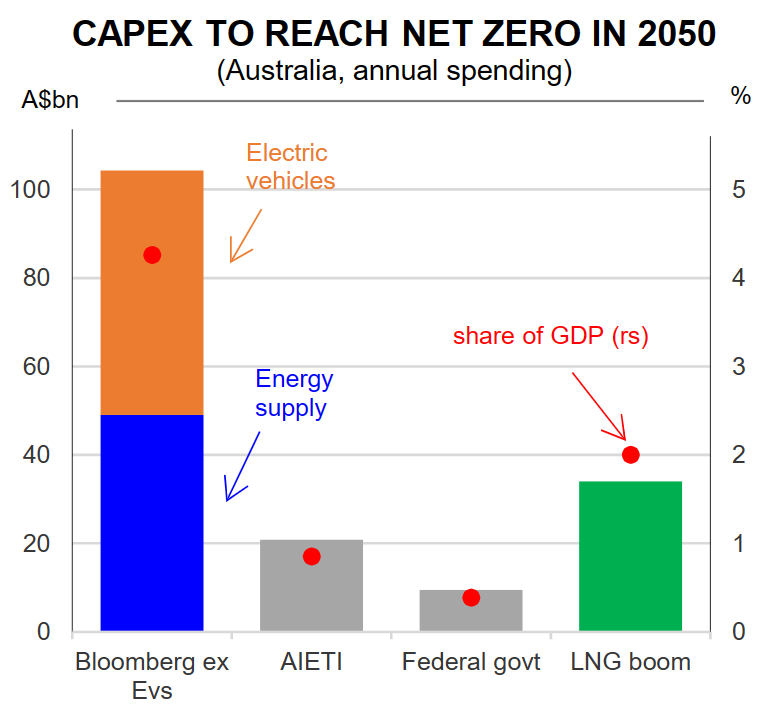
Energy supply on its own comes to around 2.0% of 2022 GDP per year. The AIETI estimates, which only includes the capex required to decarbonise some industry, equates to 0.9% of GDP per year.
For comparison, Australia’s LNG boom comprised $A340bn in capex over a 10 year period to 2018. This averaged out to around $A34bn per year, and around 2% of GDP. Annual LNG capex peaked at 3.8% of GDP in 2013.
The capex required to decarbonise energy supply can be lower per year on average than the LNG boom, but will run over a much longer time frame. According to Bloomberg NEF around $A314bn of capex is required for utility-scale wind and solar by 2050, or $A11.0bn per year.
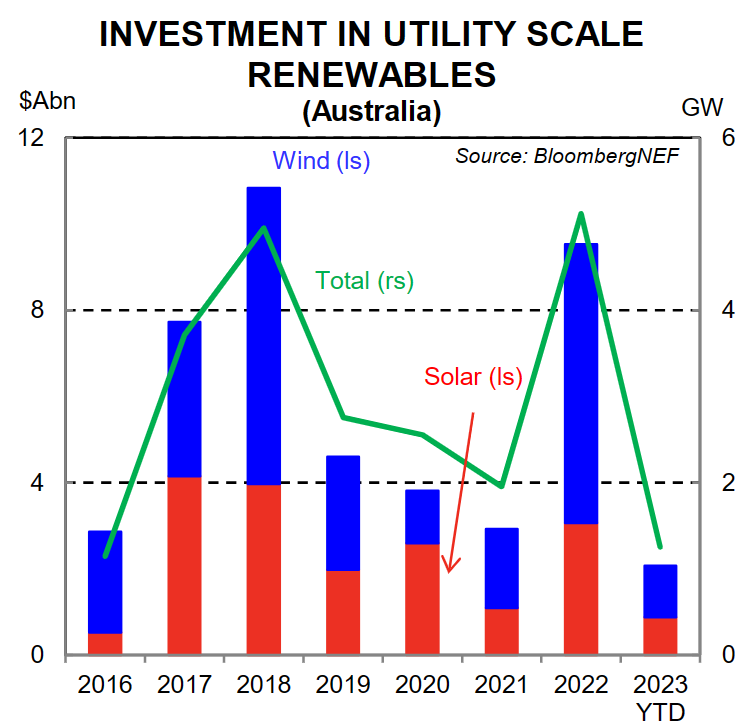
So far investment has fallen well short of these estimates (chart 4). 2022 was a record year for investment in utility-scale solar and wind in terms of capacity, with investment of $A9.5bn. For the first three quarters of 2023, investment has totalled just$A2.1bn.
There are a lot of uncertainties around these capex estimates. Many other countries are also transitioning to sustainable energy. The rush to install renewable energy will push up the demand for the minerals and metals and can push up their prices and add to the costs of construction.
But improved or new technologies may lower the cost of the assets needed to move to renewable energy. The capex required to make the renewables transition will go toward purchasing imported sustainable assets such as solar PV systems and wind turbines.
However a significant share of spending will be spent domestically, building the local infrastructure required and installing renewable assets. The additional capex required over the coming years will be occurring at a time where the pipeline of building and engineering work is elevated (chart 5).
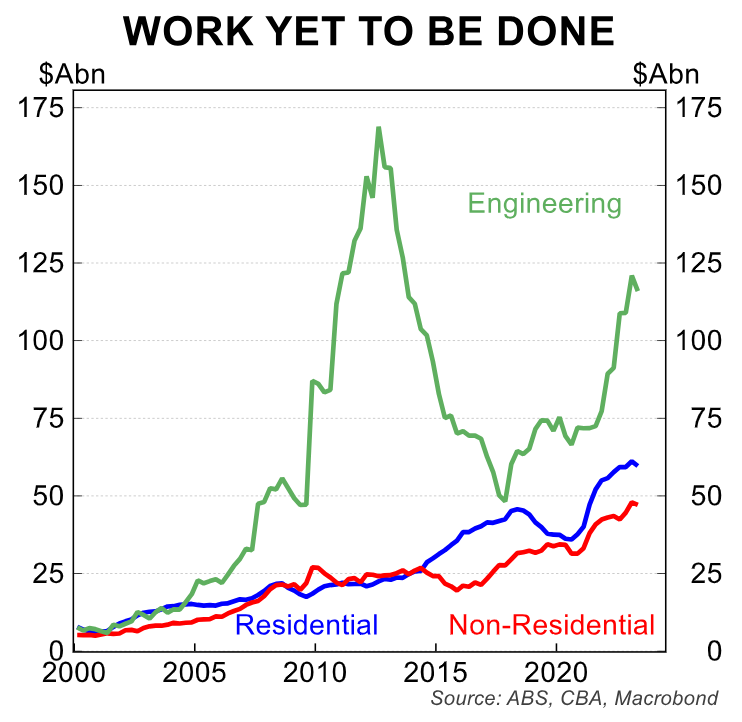
The public sector capex pipeline remains large, with around $A119.9bn in total projected for 2023/24. The Federal government’s newly announced and ambitious national housing target of 1.2 million houses over the next five years will also add greatly to demand for labour and materials in the construction industry.
Given the large amount of construction and engineering activity already underway, a ramp up in renewables investment is likely to add to capacity constraints and push up prices.
Cost blow outs and capacity constraints recently encouraged the Federal government to cancel funding for 50 infrastructure projects, saving $A7 billion. Inflation in building and engineering is already very high, highlighting existing capacity constraints (chart 6). Vacancies in the construction and engineering space remain elevated.
Even more spending will be required to become a major hydrogen exporter and critical minerals producer:
The global transition to net zero also presents Australia with a number of export opportunities, particularly green hydrogen and critical minerals.
However to seize these opportunities additional investment is needed in clean energy, transport, infrastructure, exploration and processing and manufacturing facilities.
Bloomberg NEF’s analyses a scenario where Australia makes its net zero transition and becomes a major green hydrogen exporter by 2050.
Under this scenario Australia supplies around 5½% of the world’s green hydrogen by 2050. However, a large amount of additional renewable energy will be required to produce the green hydrogen (chart 7).
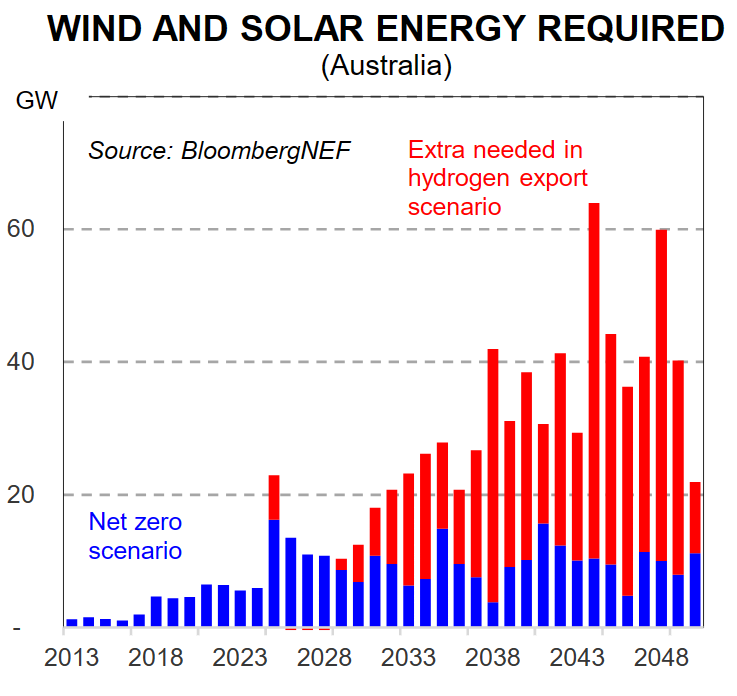
Bloomberg estimates that around $A911bn of investment is required from 2022 to 2050 in solar and wind for hydrogen, over and above the investment needed to get to net zero emissions. This averages out to an extra $A32bn per year.
Our note here discusses the current pipeline of hydrogen projects in Australia. The Australian Federal government Critical Minerals Strategy sets out the plan to grow Australia’s critical minerals sector over the next seven years.
The government has committed $A4bn through the Critical Minerals Facility to help finance projects in the critical minerals sector. But much private investment is needed too.
According to the Australian Department of Industry, Energy and Resources there are 81 critical minerals projects in the pipeline with total construction costs between $A12.5bn and $A24bn.
Electricity prices can be volatile during the transition but should ultimately be lower:
Electricity prices can be volatile while the transition to renewable energy occurs. There are likely to be mismatches between the closures of existing coal powered plants and replacement renewable electricity sources.
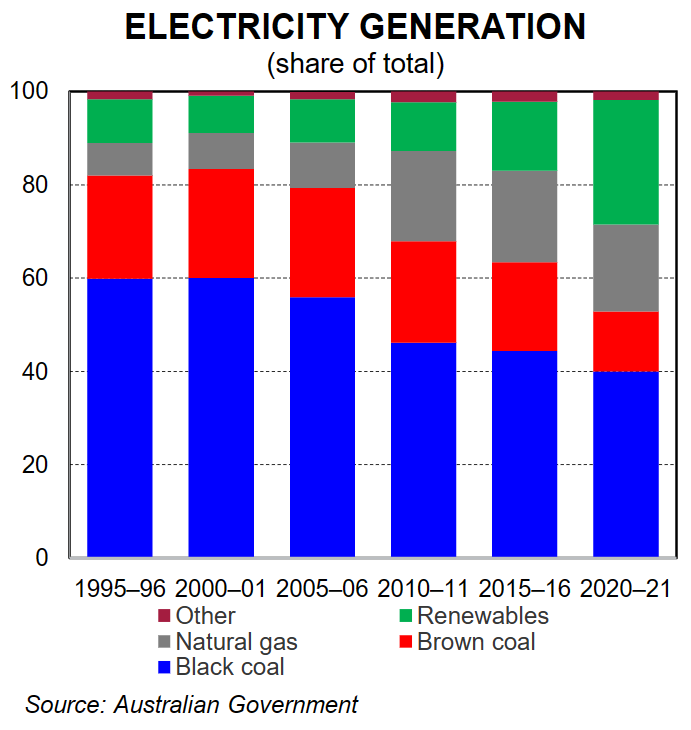
Any shortfalls are likely to be met by electricity generated by natural gas. While Australia is one of the world’s largest natural gas producers, domestic gas prices are now closely linked with international prices. This leaves Australian electricity prices highly exposed to developments in international gas markets.
A recent episode highlights the negative economic impacts of a reliance on gas for electricity. During H1 2022 Australia experienced a sharp increase in wholesale electricity prices (chart 8).
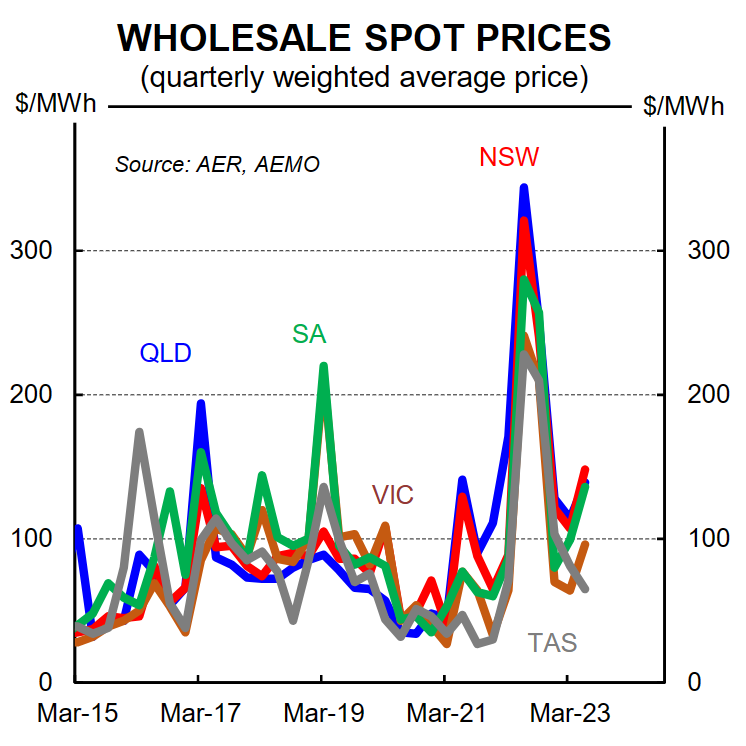
Gas prices skyrocketed because of the war in Ukraine. Wet weather dampened coal supply and planned and unplanned maintenance dampened coal power generation, increasing the reliance on gas powered electricity (chart 9).
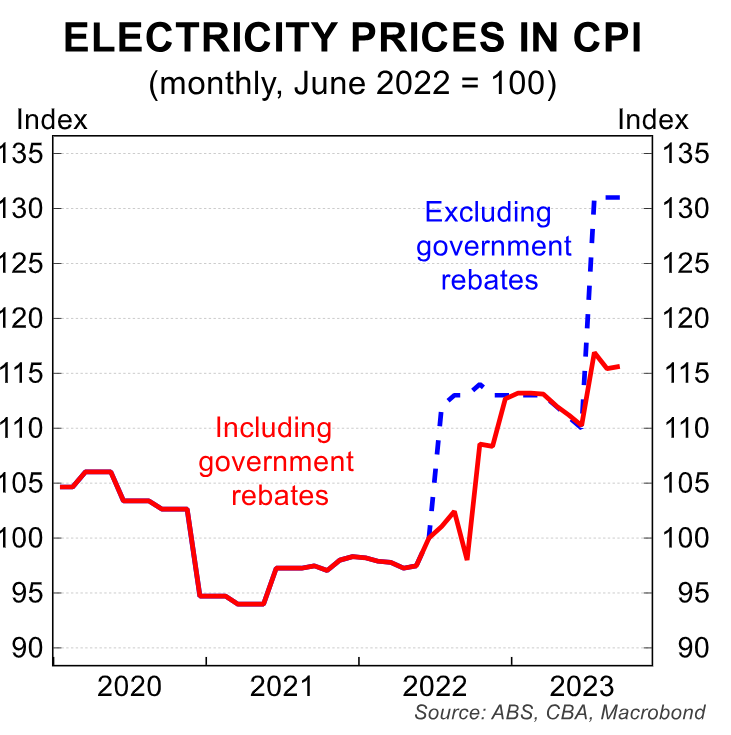
The lift in wholesale electricity prices is having a significant impact on the Australian CPI. Electricity prices in the CPI rose by a strong 6.0%/mth in July 2023 because of higher wholesale prices being passed on to customers after the annual price reviews.
However, the rise was partially offset by government Energy Bill Relief Fun rebates. Without the rebates, electricity prices would have risen by 19.2%/mth in the month (chart 10).
Stephen Wu in our Australian economics team analyses the impacts of the electricity rebates here. The Federal government estimates that the rebates will cost up to $A3 billion with the cost shared between Federal and State governments.
There is a high chance that Australian experiences similar periods of high and volatile electricity prices in the future until renewable electricity generation is scaled up. Generating renewable energy is already the cheapest form of new energy in Australia.
But to scale up the share will require investment in purpose-built renewable firming technologies and new transmission infrastructure. Bloomberg estimates that around $A340bn of spending on battery storage and transmission will be required by 2050 to transition to mostly renewable energy sources.
These additional costs will likely to be passed on to end users. However, once this infrastructure is in place we expect that energy prices can fall.
There is already a loose negative relationship between wholesale electricity prices and the share of renewables across states (chart 11).
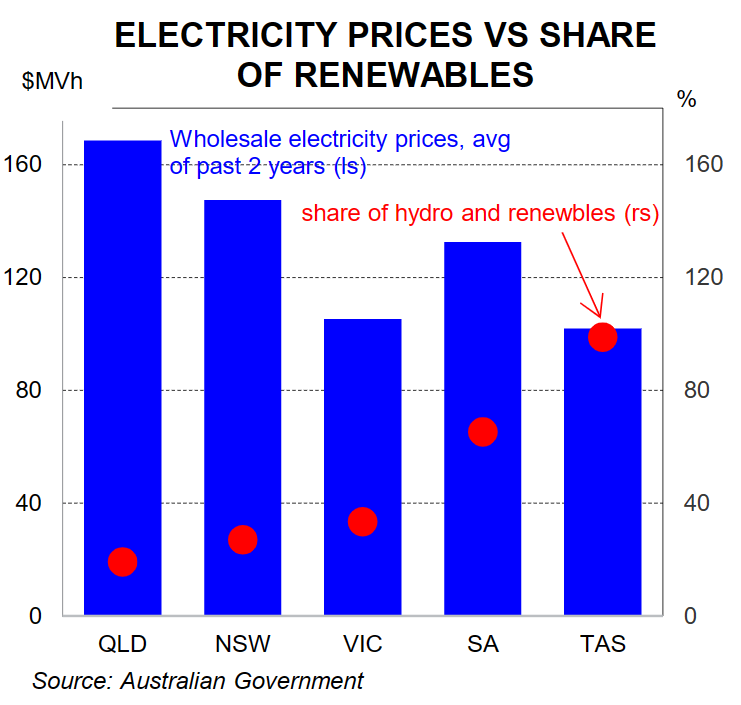
Queensland and NSW have the lowest share of renewable electricity and the highest wholesale electricity prices. Tasmania has a high share of renewable electricity and relatively low wholesale electricity costs.
South Australia is an outlier with a high share of renewable electricity but high wholesale electricity prices over recent years. This is because gas accounts for around one third of SA’s electricity and gas prices had been pushed up by the war in Ukraine.
Average prices, though, mask the significant changes taking place in electricity prices intra-year and even intra-day. Solar and wind power may be cheap when the sun is shining and the wind is blowing, but to supply power when renewables are not available will mean reliance on electricity storage (i.e. batteries and pumped hydro) and fossil fuel.
These changes explain why there is an ‘evening’ peak in wholesale electricity prices on most days in a year, as this is when solar power is no longer available.
Many households and businesses are already transitioning to renewable electricity in the form of solar panels, and lowering energy costs.
The Australian government’s Clean Energy Regulator estimates that around 31% of detached homes have solar power (chart 12).
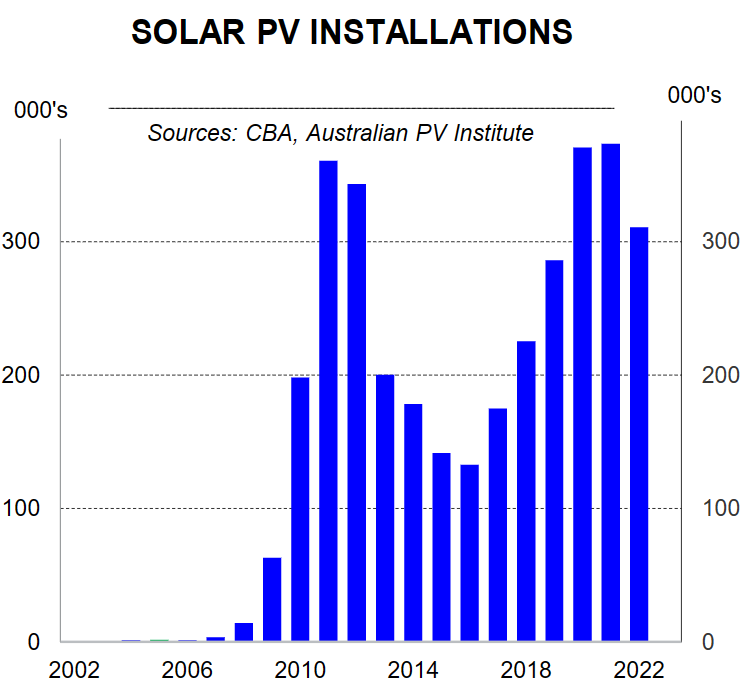
It is estimated that a typical family of four will reduce their power bill by more than half by installing solar PV panels. The time taken to pay back the cost of the solar panels is estimated to be around three to six years.
Automotive fuel costs can also drop as households and businesses move to electric vehicles:
Electricity generated by solar power can also be used to charge electric vehicles, reducing emissions and fuel costs for passenger motor vehicles.
The time in which electric vehicles are charged would be important. Electric vehicles charged during the day when solar power is readily available and cheap would maximise the energy cost savings from solar panels without batteries.
Automotive fuel currently accounts for around 3.6% of household spending. The transition to electric vehicles can weigh on this component of the CPI.
Fiscal and monetary policy can play a role in limiting impacts on inflation As discussed above, the additional capex required to make the transition to renewables will add to demand and can increase inflation pressures in the economy. Electricity prices can also be volatile while the transition is occurring and can potentially add to inflation.
However, over time households are likely to spend less on energy as more energy is sourced from cheaper renewable sources. Fiscal and monetary policy can both play a role in limiting the impact that the renewables transition has on the CPI. Governments may choose to cushion the impact during periods of high electricity prices.
The current Federal and State government energy rebates are helping households manage the current high cost of energy and reducing the impact on the CPI.
Reducing the upward pressure on the CPI can help prevent high inflation becoming embedded through higher inflation expectations.
However, it is important to note that this is not cost free and will result is larger government deficits, or smaller surpluses, than would otherwise be the case.
Government incentives to encourage households and businesses to install solar panels or energy saving technology can also reduce the share of household spending on electricity bills and lessen the impact on the CPI during periods of high wholesale electricity prices.
Monetary policy can play an important role in keeping inflation expectations anchored and overall demand and supply in the economy balanced. Government may also chose to prioritise capex required to make the sustainable transition and reduce spending in other areas to help keep demand and supply in balance.

