Chinese data was weak again. Goldman:
On the back of mixed PMI and trade data, deeper price deflation, and slightly weaker-than-expected credit data, November activity data painted a mixed picture.
Industrial production growth rose meaningfully to a stronger-than-expected +6.6%yoy in November from +4.6% yoy in October, amid faster growth in automobile production and power generation.
Retail sales growth rose to +10.1% yoy in November from +7.6% yoy in October, with improvement in both automobile and COVID-19-sensitive restaurant sales growth thanks mainly to a lower base last year amid China’s Covid “exit wave”.
However, this is well below market (high) expectations and implies a negative sequential growth based on our estimates, reflecting still-subdued private demand and weaker-than-expected CPI inflation.
The services industry output index, which is on a real basis and tracks tertiary GDP growth closely, rose to +9.3%yoy in November from +7.7% yoy in October.
Fixed asset investment growth increased to +2.9% yoy in November from +1.3% yoy in October by our estimates, slightly below expectations and suggesting the impact of recent policy easing has not fully kicked in.
Taking stock of November activity data and our high-frequency trackers, we believe China’s sequential growth momentum remains largely stable, while favourable base effects should help boost year-on-year GDP growth in Q4 vs.Q3.
Shifting to real estate, there was also mixed news. Sales remain poor, down by more than one third from the peak:

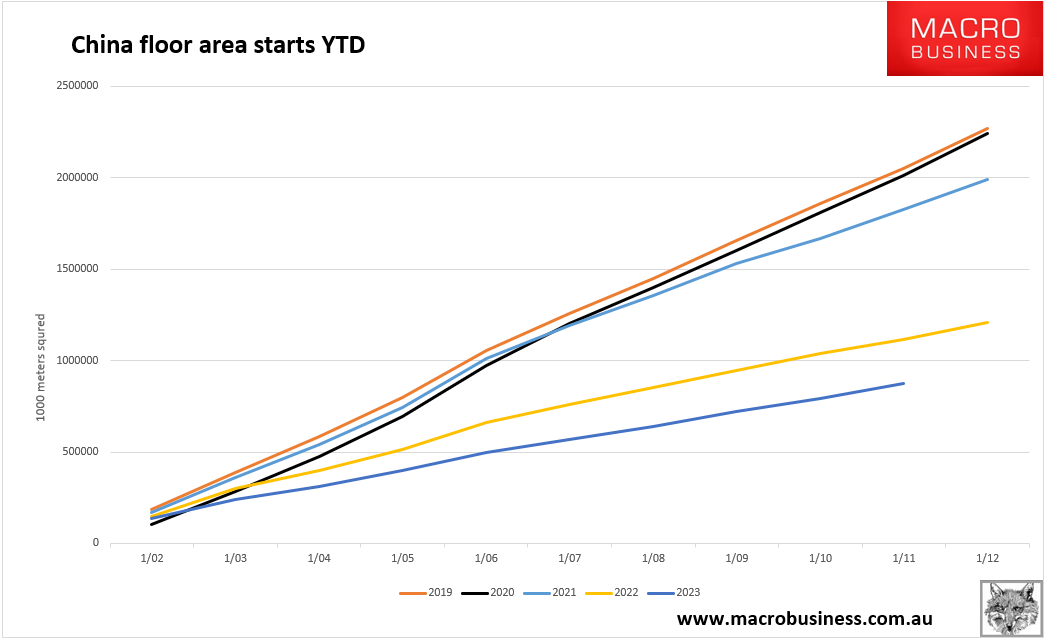
And starts are catastrophic, down by around two-thirds from peak:

But, year-on-year starts for November did finally post growth a little growth:

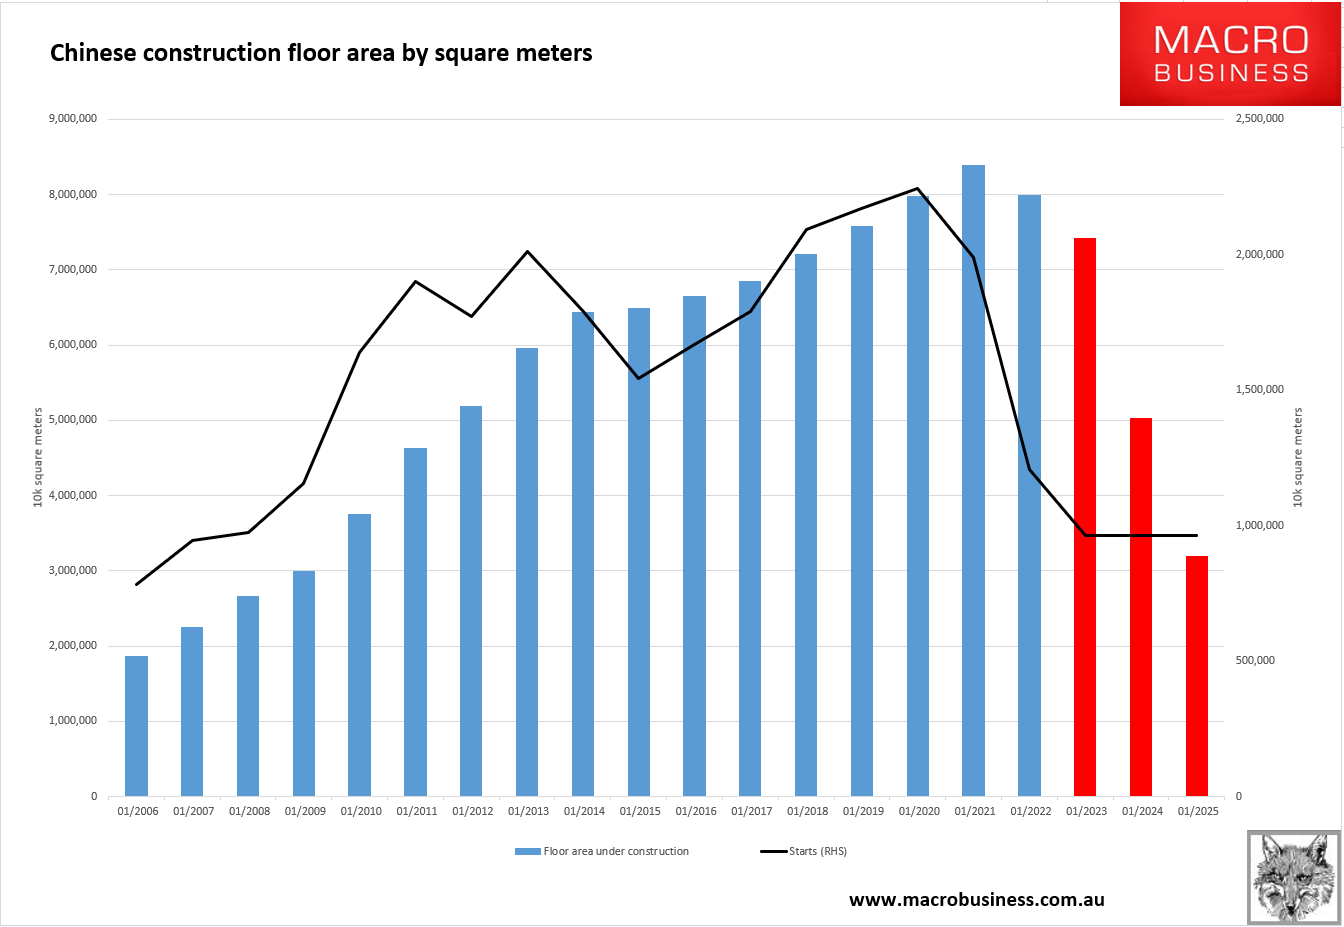
If we are at the bottom for the flow of floor area starts then that is something. Even if the falls to date are so stupendous that the catch-down in the stock of floor area under construction ahead remains calamitous:

In truth, this is a single green shoot in a scorching hot desert. House prices are still falling where it matters. Goldman again:
The National Bureau of Statistics’ 70-city house price data suggests the weighted average property price in the primary market fell sequentially in November after seasonal adjustments.
The decline in sequential growth of house prices was most significant in Tier-3/4 cities.
The proportion of 70 cities that experienced sequentially higher property prices declined in both the primary market and secondary market in November.
Our high frequency tracker suggests that 30-city new home transaction volume declined by 22.4% yoy month-to-date in December.
Major cities’ inventory months (sellable gross floor area divided by 12-month rolling gross floor area sold) fell to 23.5 in November from 23.8 in October, with the decrease mostly led by Tier-3 cities.
November money and credit data suggested growth of household medium-to-long term loans, which are mostly mortgages, decelerated in sequential terms in November from October.
Following the easing announcements on property policy, we continue to expect more housing easing measures in coming months, including more relaxation of home purchase restrictions in large cities, among others.
For example, Beijing and Shanghai just announced policies to lower downpayment ratios and mortgage rates this week.
However, considering persistent property weakness srelated to lower-tier cities and private developers, such easing measures may only lead to an “L-shaped” recovery in the sector in coming years.
Yep. Which means the catch-down from flow to stock in construction volumes is inevitable. Timing is the issue.

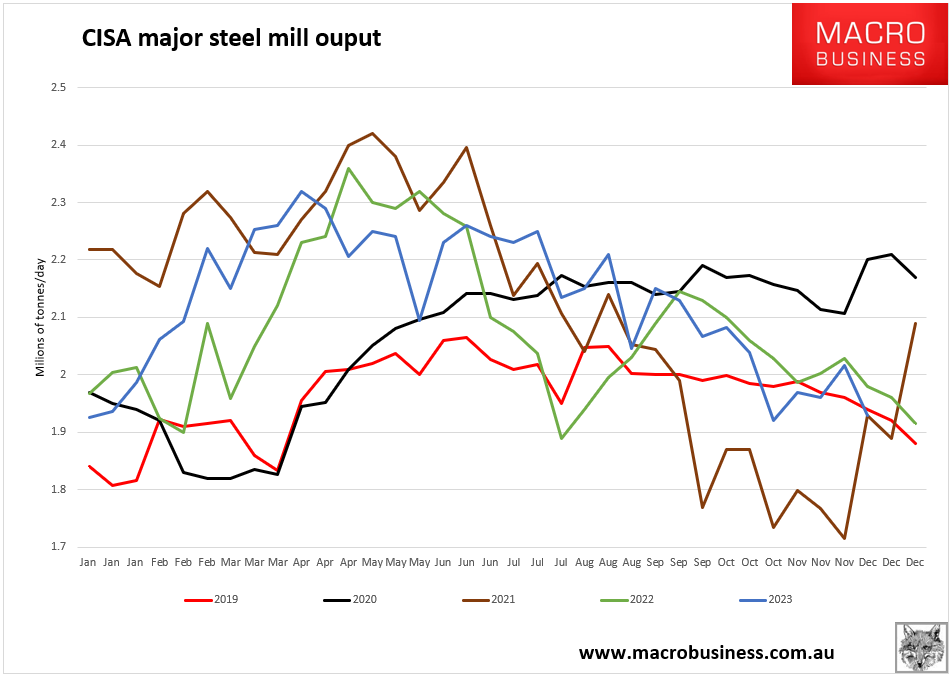
Which brings us to steel. Output is ending the year weak:

It has continued into December in CISA numbers:

Pig iron ore output was thumped seasonally:

But, ominously, it did take a hit from a rebounding recycling share:

There is nothing here to rationalise iron ore above $100 let alone $130.

