The chief economist at IFM Investors, Alex Joiner, posted the below chart on Twitter (X) showing the massive divergence in household debt between Australia and Canada on the one hand and the United States on the other:
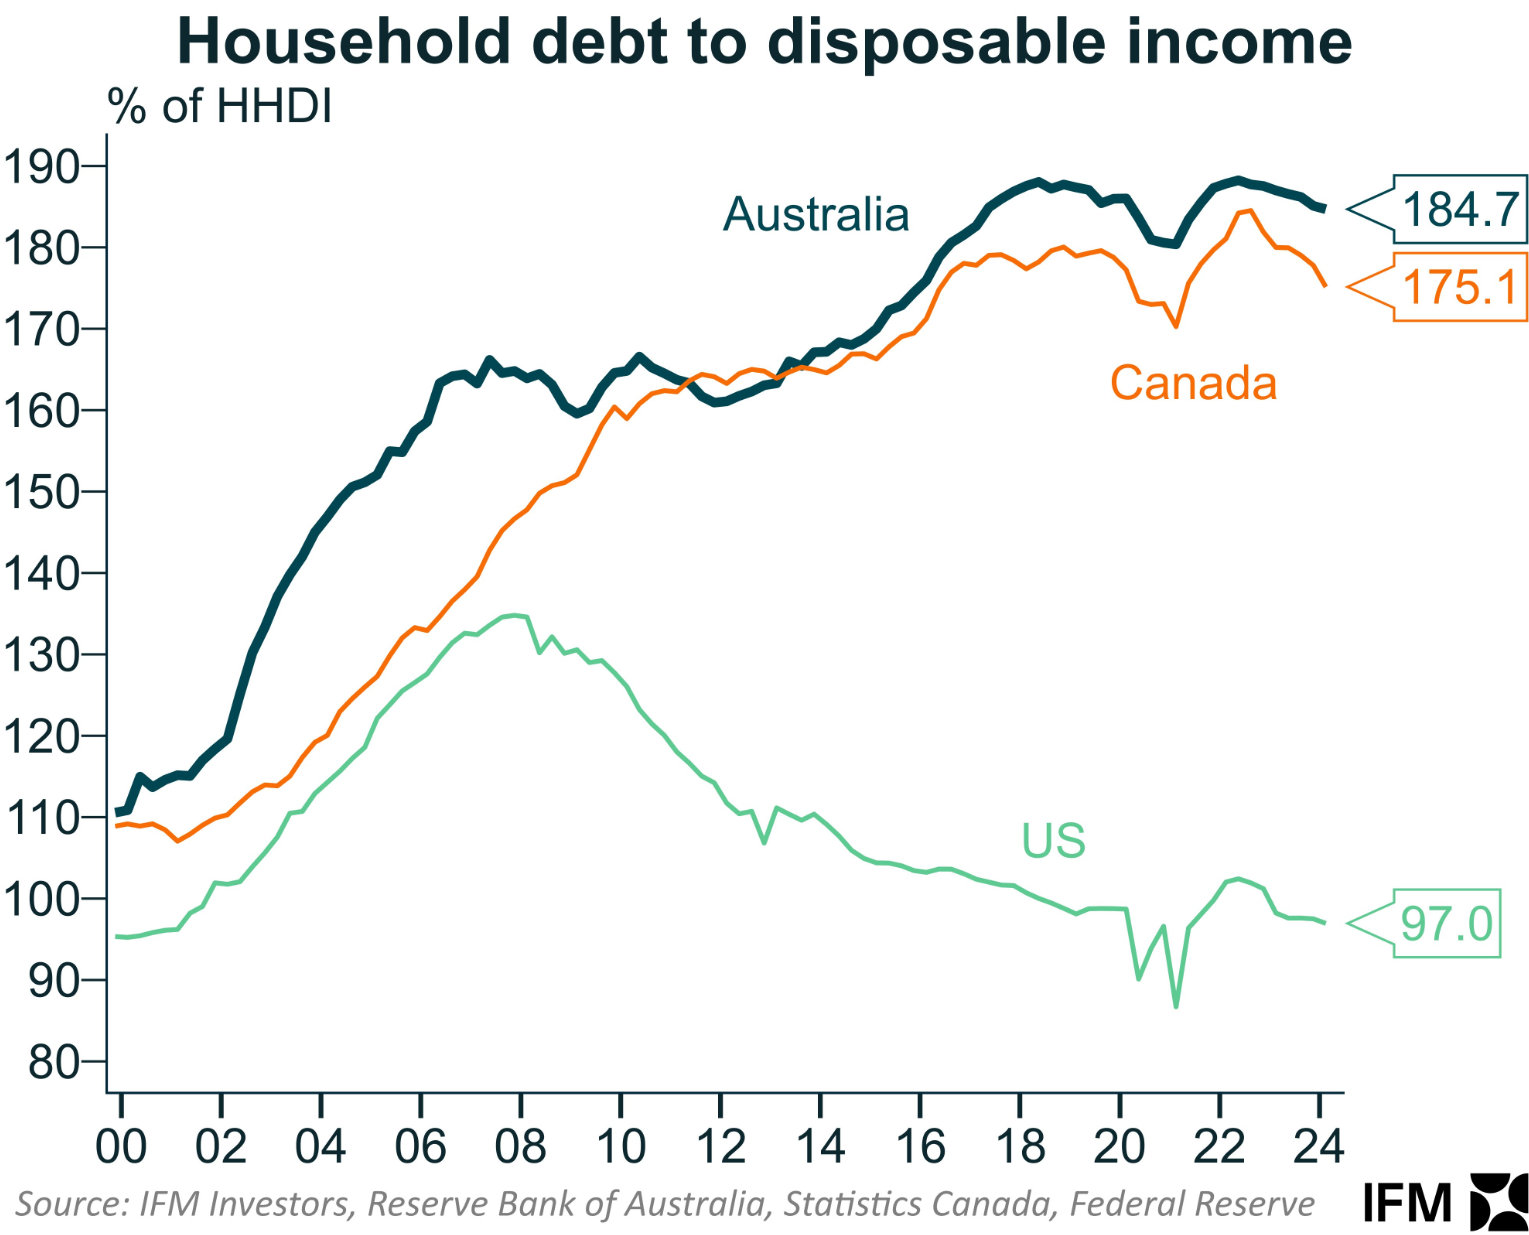
As you can see, the United States deleveraged significantly after the Global Financial Crisis, whereas Australia and Canada leveraged up.
As a result, Australians and Canadians are sacrificing a much larger share of their incomes on debt servicing compared to Americans:
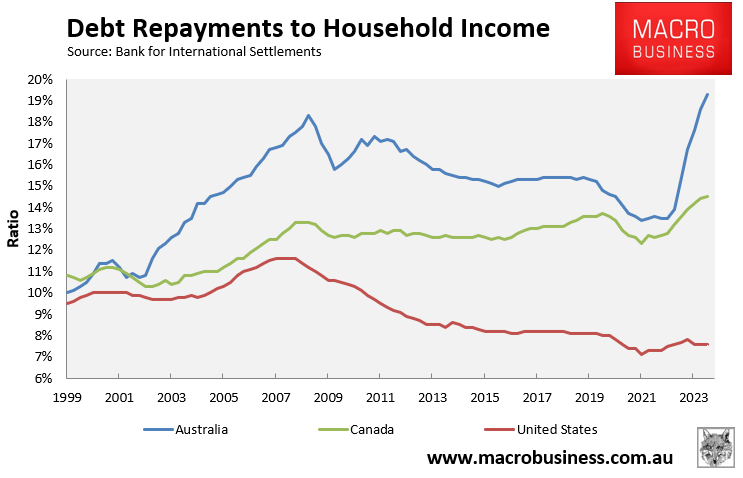
The situation in Australia is especially bad given we have both a higher debt load as well as a higher share of variable rate mortgages than either Canada or the United States.
The situation is similar with respect to housing valuations.
The total value of the residential housing stock was valued at 3.9 times GDP in Australia and 3.1 times GDP in Canada in 2023, easily eclipsing the United States at 1.8 times GDP:
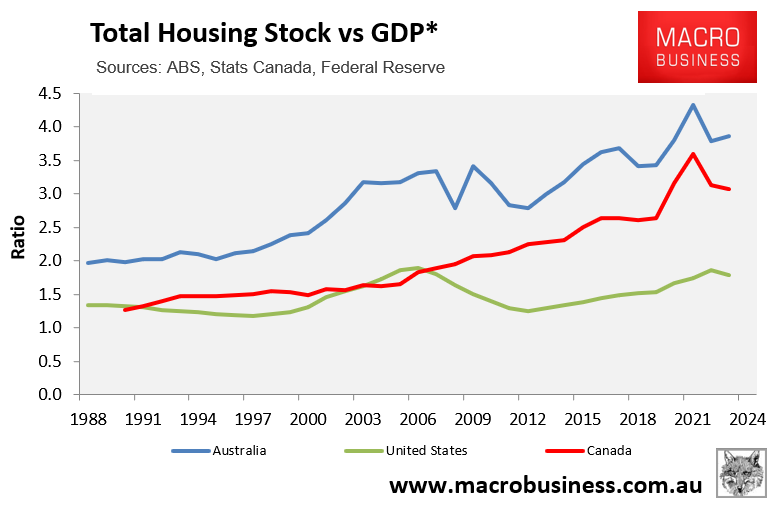
Once again, the United States economy did not leverage into housing after the Global Financial Crisis, whereas Australia and Canada doubled-down.
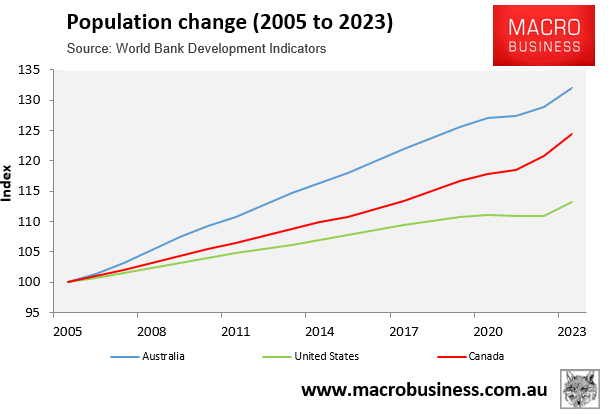
Both Australia and Canada have also grown their populations aggressively via net overseas migration, whereas the United States has grown more moderately.
Between 2005 and 2023, Australia’s population ballooned by 32% and Canada’s by 24%, easily eclipsing the 13% population growth recorded in the United States:
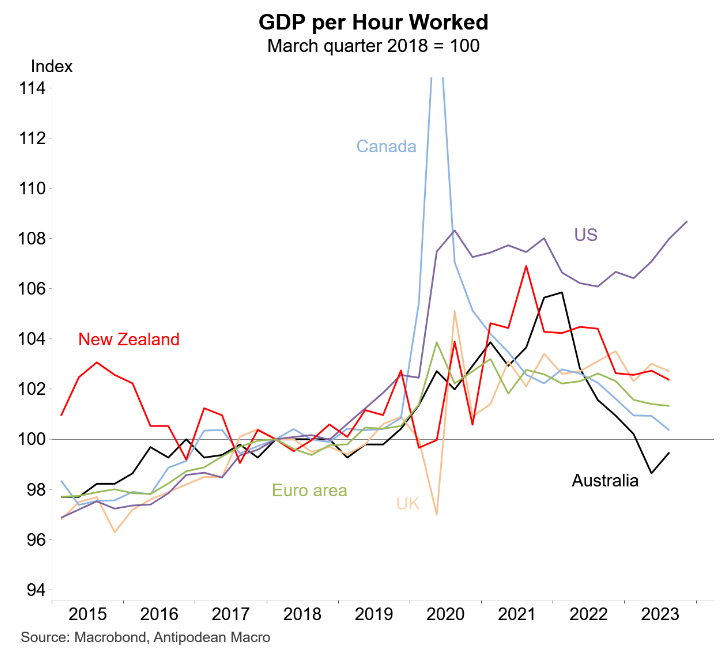
Given the above facts, it should be no surprise that the United States has recorded far stronger labour productivity growth than either Australia or Canada, which have lagged other advanced nations:
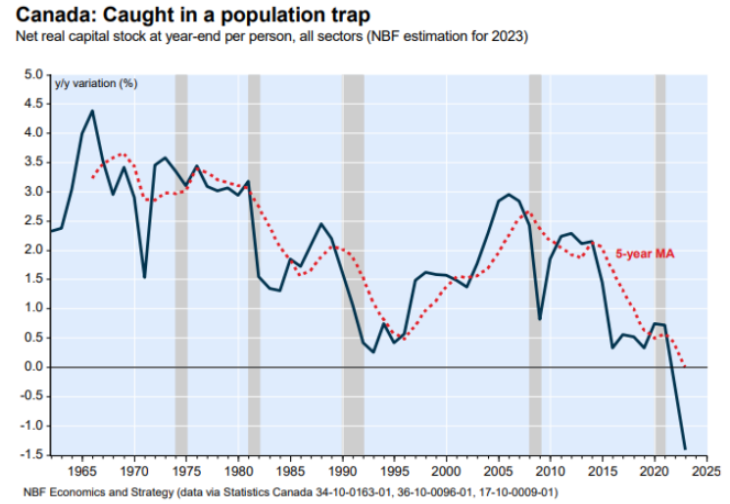
Both Australia and Canada have suffered from “capital shallowing”, which happens when business and infrastructure investment fail to keep pace with population growth, resulting in less capital per worker.
Below is a chart on Canada’s capital shallowing via economists at the National Bank of Canada:
And here is a similar chart for Australia from independent economist Gerard Minack:
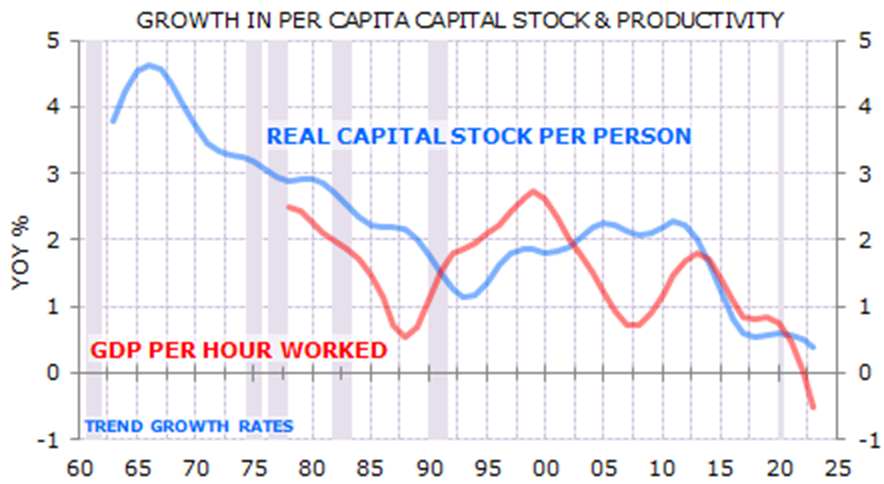
Source: Gerard Minack.
Both Australia and Canada bet their economies on housing and immigration and lost.

