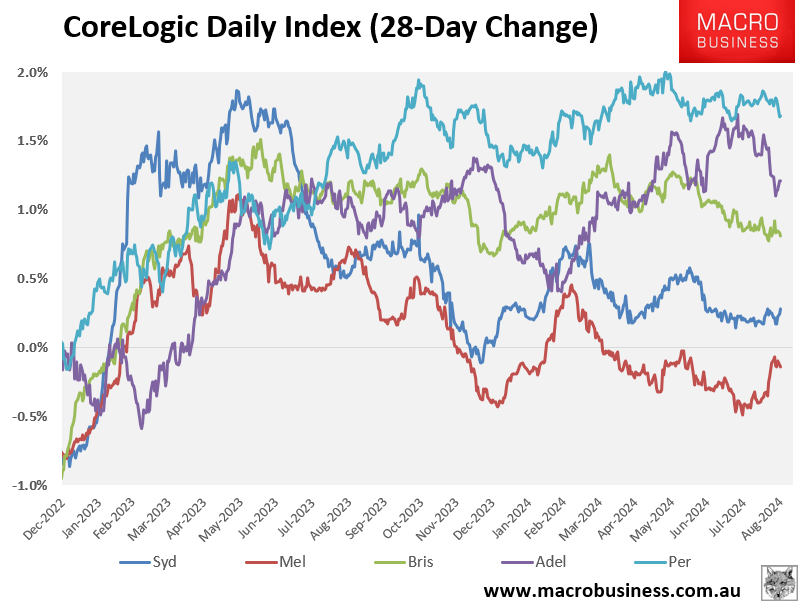
CoreLogic’s latest dwelling value results showed that the major capital city markets are two-speed, with Sydney and Melbourne recording slow or negative growth. By contrast, Perth, Adelaide, and Brisbane continue to boom:

The growing supply of homes for sale in Melbourne and Sydney has contributed to the slowing of dwelling values.
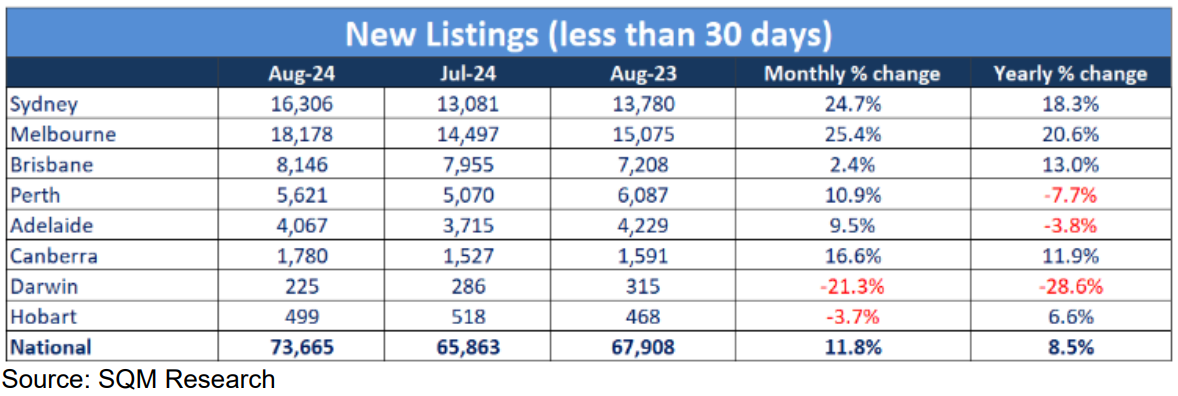
The following table from SQM Research shows that new listings surged by 25.4% (Melbourne) and 24.7% (Sydney) in August, to be up 20.6% and 18.3% year-on-year, respectively:

Sydney’s new listings counts were the highest recorded since November 2021 and were the highest levels for a month of August, ever recorded by SQM Research.
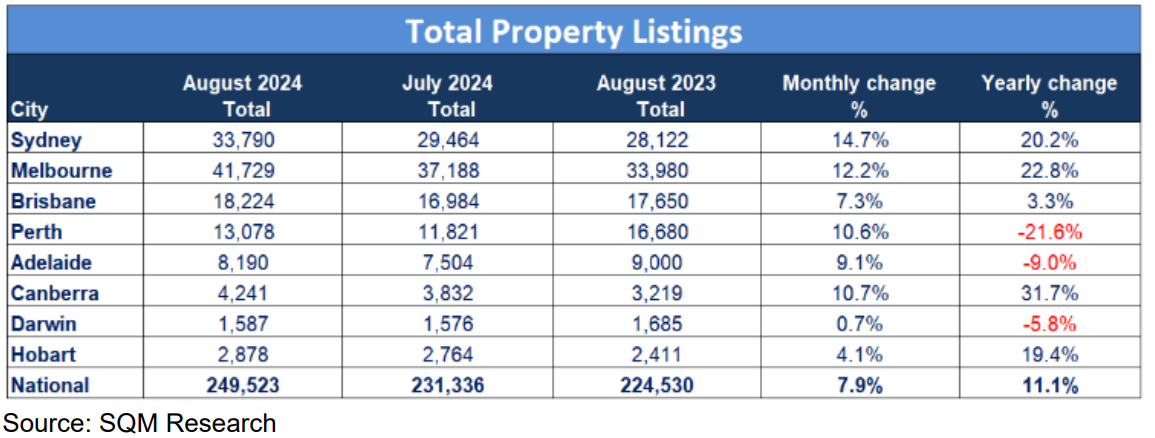
Total listings in these two markets also increased by 12.2% (Melbourne) and 14.7% (Sydney) in August, to be up 22.8% and 20.2% year-on-year, respectively:

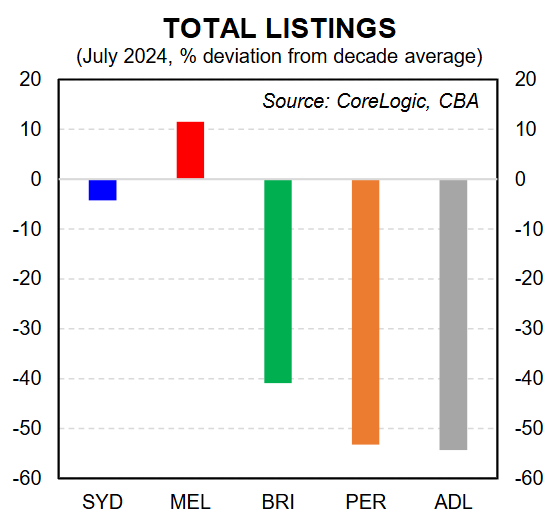
The following chart from CBA, derived from CoreLogic data, shows that the number of listings is well below the decade average across Adelaide, Perth, and Brisbane.
By contrast, listings are only slightly below the decade average in Sydney and are around 11% above the decade average in Melbourne:

The imbalance between market demand and supply in Adelaide, Perth, and Brisbane helps to explain why these markets have experienced far stronger house price appreciation.

