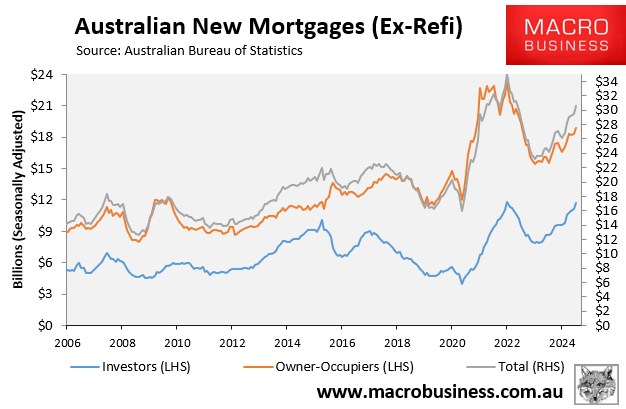
The Australian Bureau of Statistics (ABS) released mortgage data for July, which showed that the total value of new housing loans rose 3.9% in July to $30.6 billion, led by a 5.4% jump in investor lending to $11.7 billion:
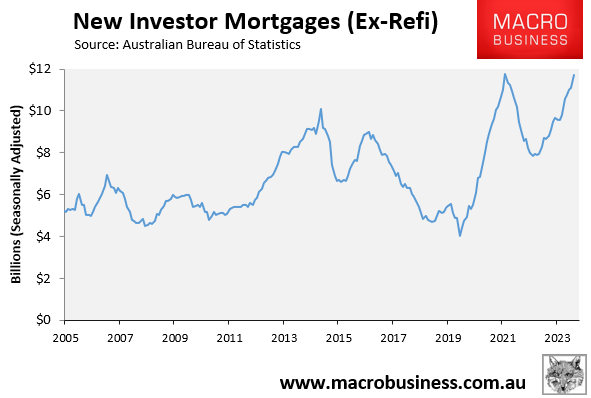
The following chart focuses on investor lending, which has risen back to its January 2022 peak following a 35.4% annual rise:
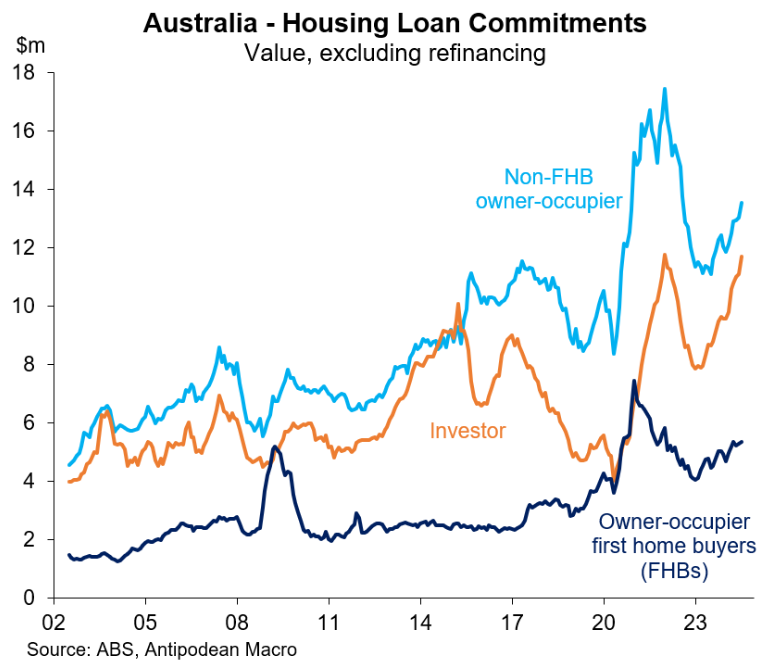
The following chart from Justin Fabo at Antipodean Macro shows that non-first home buyer (FHB) owner-occupier mortgage commitments have also posted a solid rebound, whereas owner-occupier FHB demand has failed to launch:
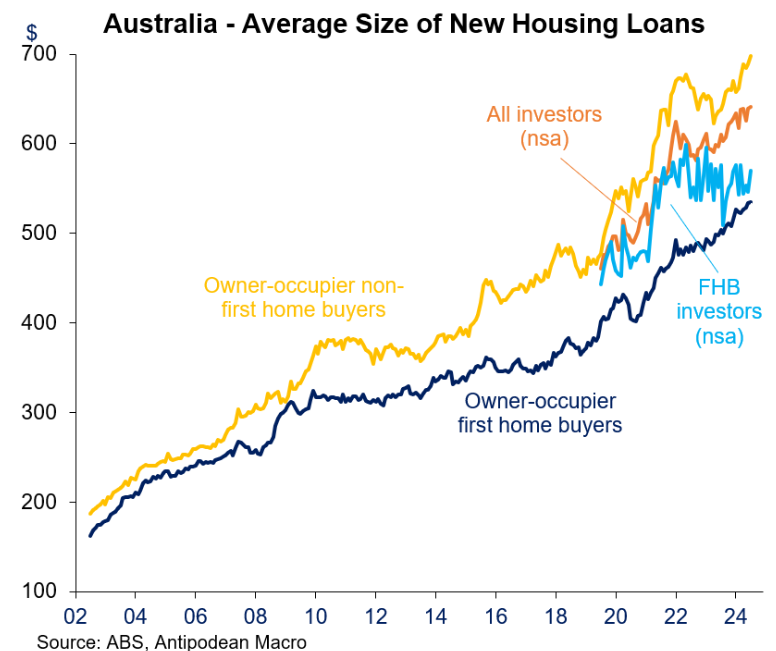
The relative weakness FHB demand is attributable to stretched affordability. This is reflected by the average loan size for FHBs being well below upgraders and investors:
The following chart tracking mortgage shares also shows how FHBs are being crowded-out by investors:
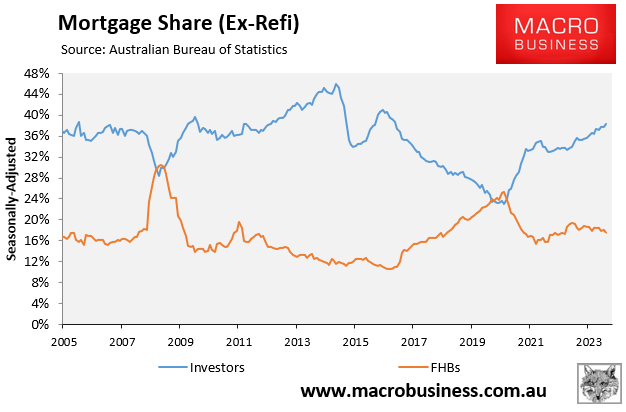
As you can see, investor mortgage commitments are inversely correlated with FHB mortgage commitments.
Therefore, when investor commitments surge, as they are currently, it is typically met with a commensurate decline in FHB mortgage commitments.
Investors typically have larger budgets and capacity to pay than FHBs. So, when investor demand rises, they typically outbid FHBs, as illustrated in the average loan size chart above.
The implication of this is that one of the best ways to entice FHBs into the market and to increase home ownership is to make property investment less attractive, such as through reforming property tax concessions (e.g., negative gearing and CGT).
A reduction in investor demand would likely be met with a commensurate rise in FHB activity.

