While the latest US PPI print on Friday night was mixed, and the Middle East looks like the proverbial powder keg, risk markets decided to hit a higher gear and buy everything with Wall Street making another record high, pulling along European equities as well. Stock futures indicate this should translate to a good start here in Asia for the trading week. The USD firmed against most of the majors with Euro still quite depressed while the Australian dollar was able to lift slightly above the mid 67 cent level.
10 year Treasury yields lost a little bit of ground but remain just above the 4% level while oil prices wobbled around as Brent crude eventually finished around the $79USD per barrel level. Gold made further gains as it continued its bounce off the $2600USD per ounce level to almost get back to its previous highs.
Looking at markets from Friday’s session in Asia, where mainland Chinese share markets were quite volatile with the Shanghai Composite losing nearly 2.5% to push further below the 3300 point barrier while the Hang Seng Index was closed for a holiday.
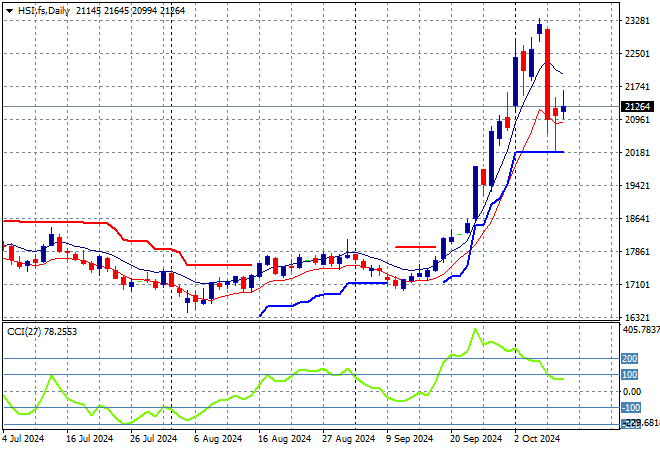
The Hang Seng Index daily chart shows how short term resistance was finally being pushed away with a huge breakout above the 19000 point level that then set up for a run at the 20000 level in the response to PBOC stimulus. I was always wary of a sharp retracement on profit taking here on the return of mainland markets and here we are with the 20000 point level setting up for support:
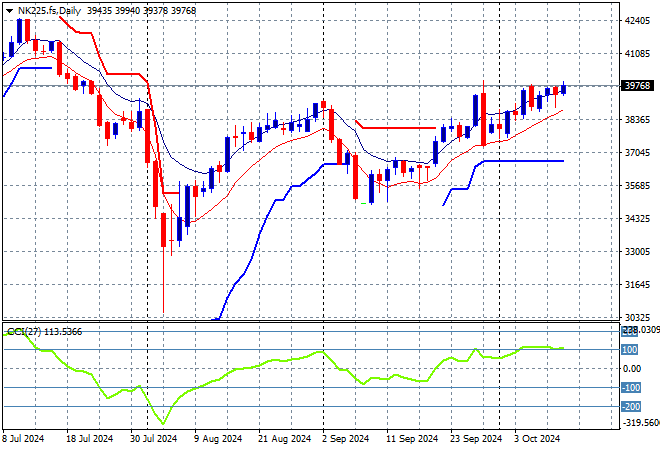
Meanwhile Japanese stock markets were up slightly with the Nikkei 225 closing some 0.5% higher at 39605 points.
Price action had been indicating a rounding top on the daily chart with daily momentum retracing away from overbought readings with the breakout last month above the 40000 point level almost in full remission. Yen volatility remains a problem here, with a sustained return above the 38000 point level from May/June possibly on the cards as positive momentum is building but futures are indicating a possible uptick as we get away this week:
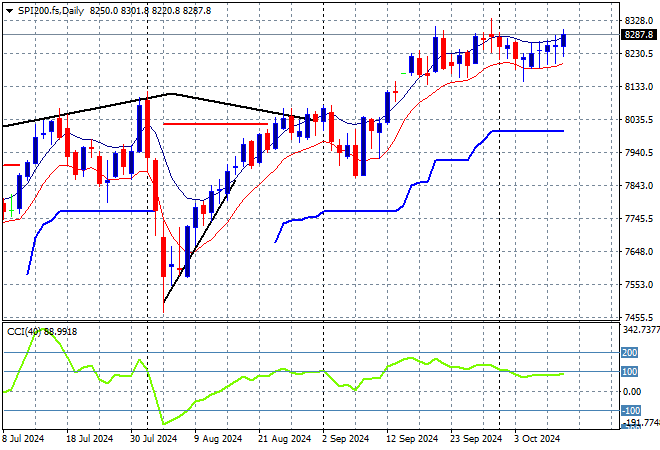
Australian stocks went nowhere fast with the ASX200 fell back just 0.1% to close at 8213 points.
SPI futures are up nearly 0.6% as Wall Street rebounded on Friday night. Short term momentum and the daily chart pattern was potentially signalling a top but price action still shows a clear breakout to new highs with momentum somewhat overbought, but some buying exhaustion might be setting in:
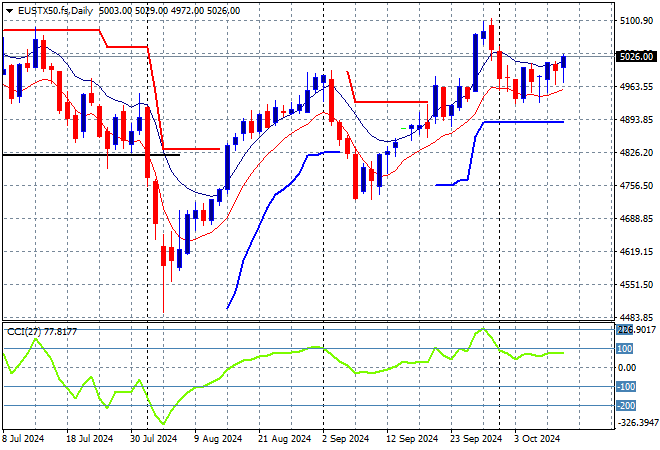
European markets pushed higher after being hesitant all week with solid gains across the continent as the Eurostoxx 50 Index closed nearly 0.7% higher to close above the 5000 point level.
The daily chart shows price action off trend after breaching the early December 4600 point highs with daily momentum retracing well into an oversold phase. This was looking to turn into a larger breakout with support at the 4900 point level quite firm with resistance just unable to breach the 5000 point barrier. Price had previously cleared the 4700 local resistance level as it seeks to return to the previous highs but momentum is not quite overbought here:
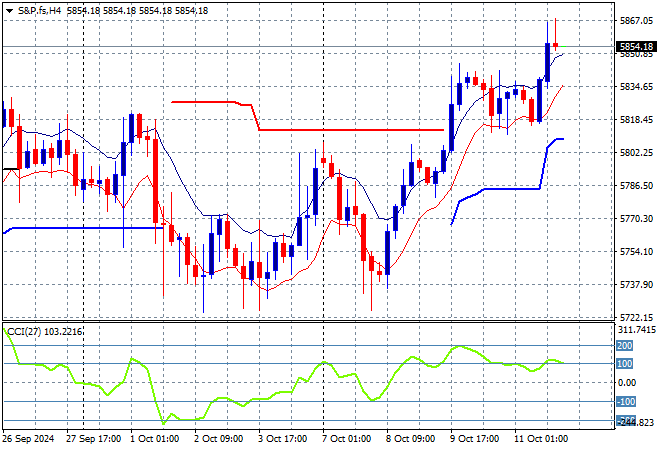
Wall Street saw a series of new record highs across the board although tech stocks lagged as the NASDAQ gained just 0.3% while the S&P500 closed more than 0.6% higher at 5815 points.
The four hourly chart illustrates the series of breakouts since the early September lows as Fed signalling is doing its thing. Price action had a small breakout on the previous NFP print but the sequential hurricanes and Middle East tensions took a toll before CPI/PPI volatility is swinging back higher again. I’m a bit wary of a top here:
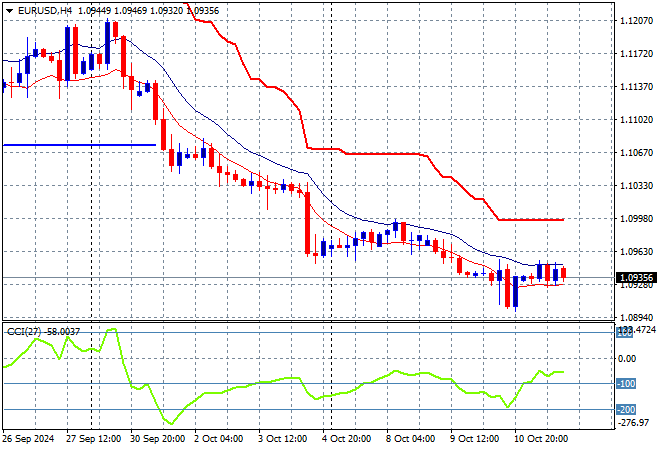
Currency markets are remaining in the thrall of USD strength despite the US PPI print being somewhat mixed and amid the geopolitical strife but King Dollar keeps squeezing Euro below the 1.10 handle after its breakdown on last Friday’s NFP print as it remains at the 1.09 level.
The union currency had been structurally supportive before the Fed meeting and US jobs report but a double plunge indicated more weakness in the short term as momentum collapsed into the oversold zone with a breakdown of short term ATR support as well. Overhead resistance has now moved to the 1.11 level in the short term with any breaks above the 1.10 level likely temporary:
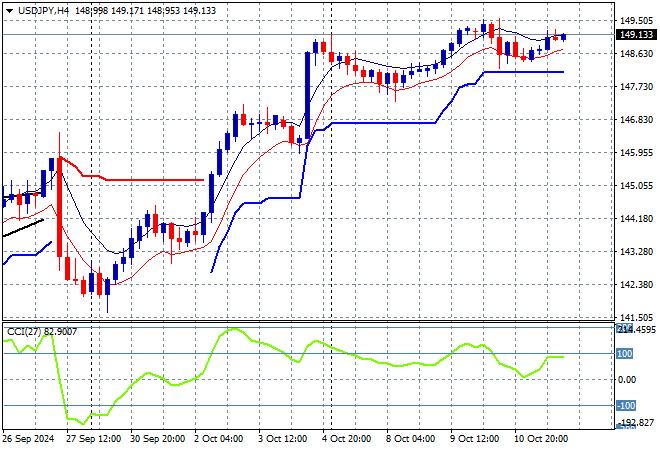
Rate hike speculation sent the USDJPY pair higher last week and the stronger USD has kept it elevated over the weekend gap as its holds above the 149 level on Friday night after breaking through the 149 handle in the previous session.
Momentum had gotten very oversold following the break of the bearish rising wedge pattern and I thought this could be a dead cat bounce with another return to the 140 level but that was nullified with this reversal potentially having more legs in the coming sessions so watch for the 150 level to possibly come under threat next:
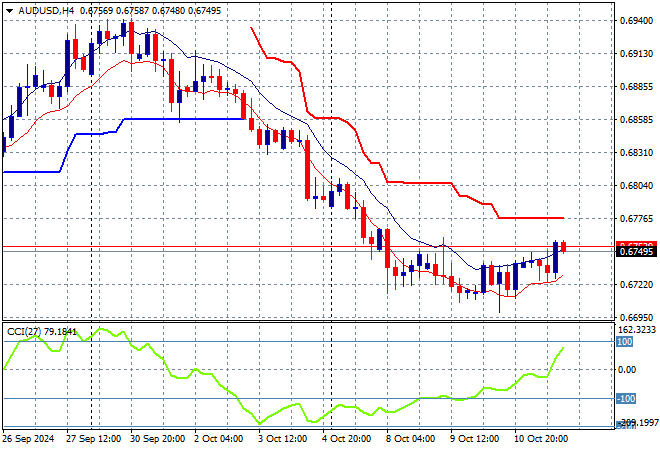
The Australian dollar is still bound at short and meditum term support after dropping below the 68 cent level before Friday’s NFP print but has tried to bounce off the 67 cent level on oversold reactions.
During June the Pacific Peso hadn’t been able to take advantage of any USD weakness with momentum barely in the positive zone but that has changed in recent weeks with price action finally getting out of the mid 66 cent level that acted as a point of control. This looks like a bottoming action but I’m wary of a potential reversal here:
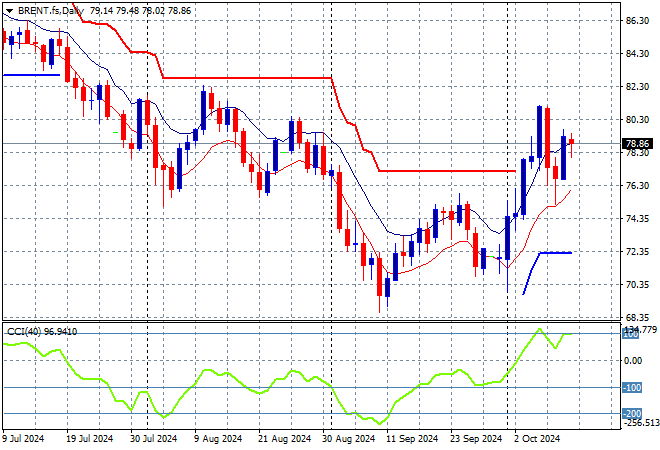
Oil markets are still high in volatility as the Middle East wars spread, with Brent crude eventually closing just below the $79USD per barrel level on Friday night.
After breaking out above the $83 level last month, price action had stalled above the $90 level awaiting new breakouts as daily momentum waned and then retraced back to neutral settings. Daily ATR support had been broken but short term momentum was only slowly getting out of negative territory, but this could be another move higher:
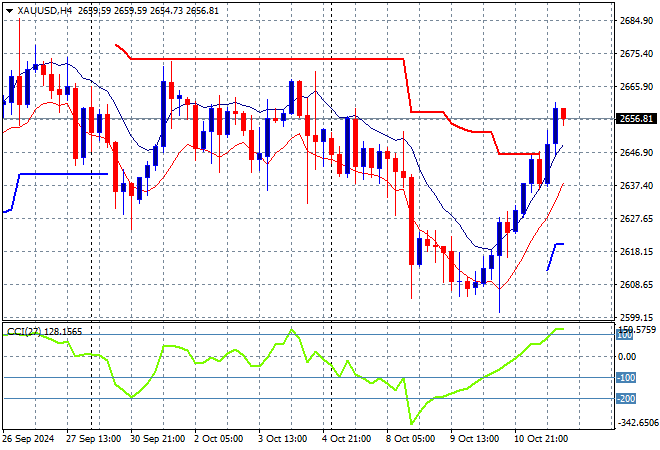
Gold had previously failed returned to its former high at the $2660USD per ounce level after bouncing off short term support but was able to push further on Friday night with a sustained move up to, but not above that key level.
Price action is trying to get back to the more dominant medium term trend amid the short term confusion and volatility around the US CPI print and this looks like shaking itself it out but it needs to clear the $2660 zone firmly next:
Glossary of Acronyms and Technical Analysis Terms:
ATR: Average True Range – measures the degree of price volatility averaged over a time period
ATR Support/Resistance: a ratcheting mechanism that follows price below/above a trend, that if breached shows above average volatility
CCI: Commodity Channel Index: a momentum reading that calculates current price away from the statistical mean or “typical” price to indicate overbought (far above the mean) or oversold (far below the mean)
Low/High Moving Average: rolling mean of prices in this case, the low and high for the day/hour which creates a band around the actual price movement
FOMC: Federal Open Market Committee, monthly meeting of Federal Reserve regarding monetary policy (setting interest rates)
DOE: US Department of Energy
Uncle Point: or stop loss point, a level at which you’ve clearly been wrong on your position, so cry uncle and get out/wrong on your position, so cry uncle and get out!