The Australian Bureau of Statistics (ABS) released its annual national accounts for the financial year 2023-24, which include detailed information on land values.
Land values supporting the Australian housing market grew by 8.8% in the 2023–24 financial year.
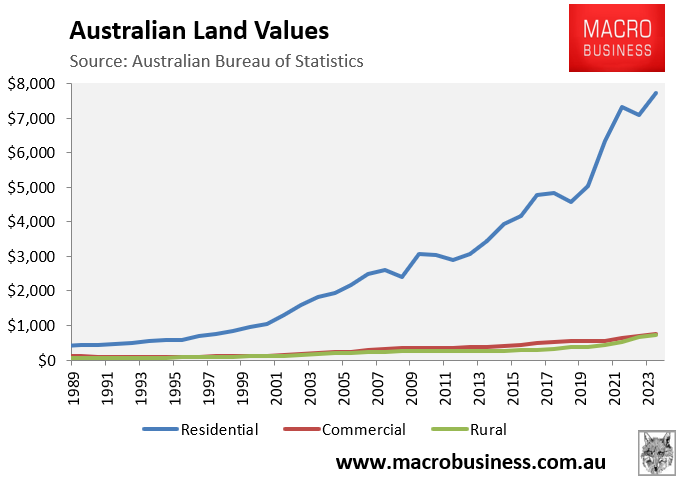
Australia’s land was valued at $9.2 trillion in 2023-24, with residential land ($7.7 trillion) comprising 84% of the total.
The following chart depicts Australia’s aggregate land values by use in relation to the country’s gross domestic product (GDP) since 1989, the earliest data available:
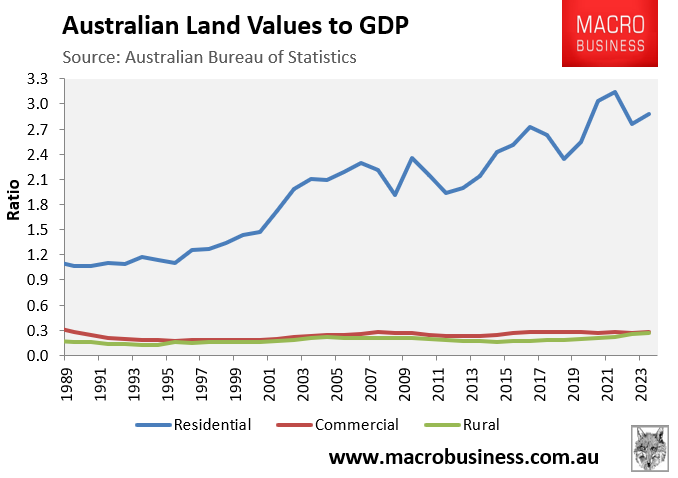
Whereas aggregate Australian commercial and rural land values have stayed relatively steady in relation to GDP over the last 35 years, residential land values have exploded, going from 1.1 times GDP to 2.9 times GDP by 2023-24.
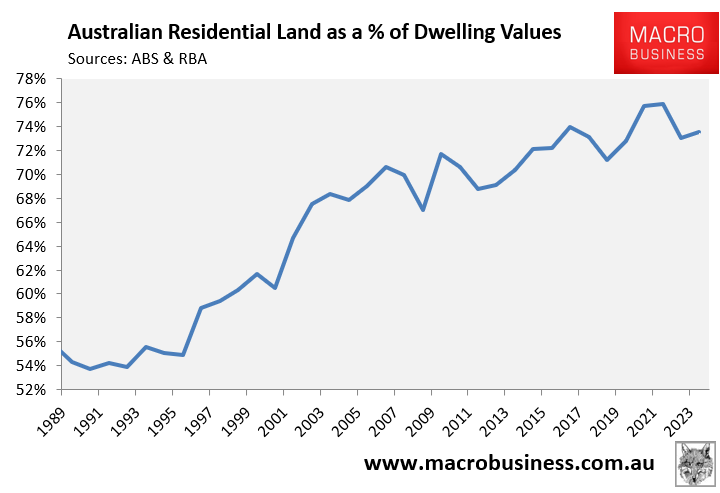
When the aggregate residential land values data is combined with the Reserve Bank of Australia’s (RBA) dwelling values data, which includes both residential land values and structures (buildings), it is clear that the increase in Australia’s housing values over the last 25 years was driven by rising land costs:
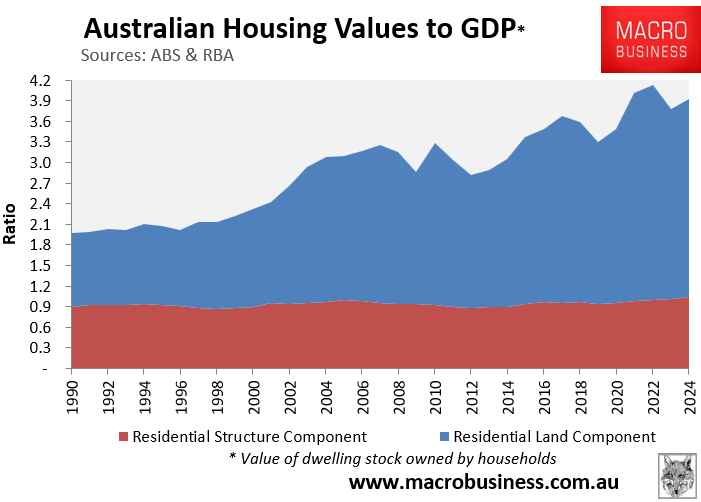
Aggregate structure values, derived by subtracting the ABS’ residential land value estimates from the RBA’s dwelling assets statistics, were 0.88 times GDP in 1988-89 and have risen to 1.04 times GDP as of 2023-24.
In contrast, the total value of Australia’s housing stock (land plus structures) increased to from 2.0 times GDP in 1988-89 to 3.9 times GDP in 2023-24, driven by rapidly inflating in land values.
Reflecting the fact that residential land has increased in value relative to structures, the land component of Australia’s housing stock has risen from 54% in 1990-91 to 74% of GDP in 2023-24.
The increase in land costs is also reflected in the new home market.
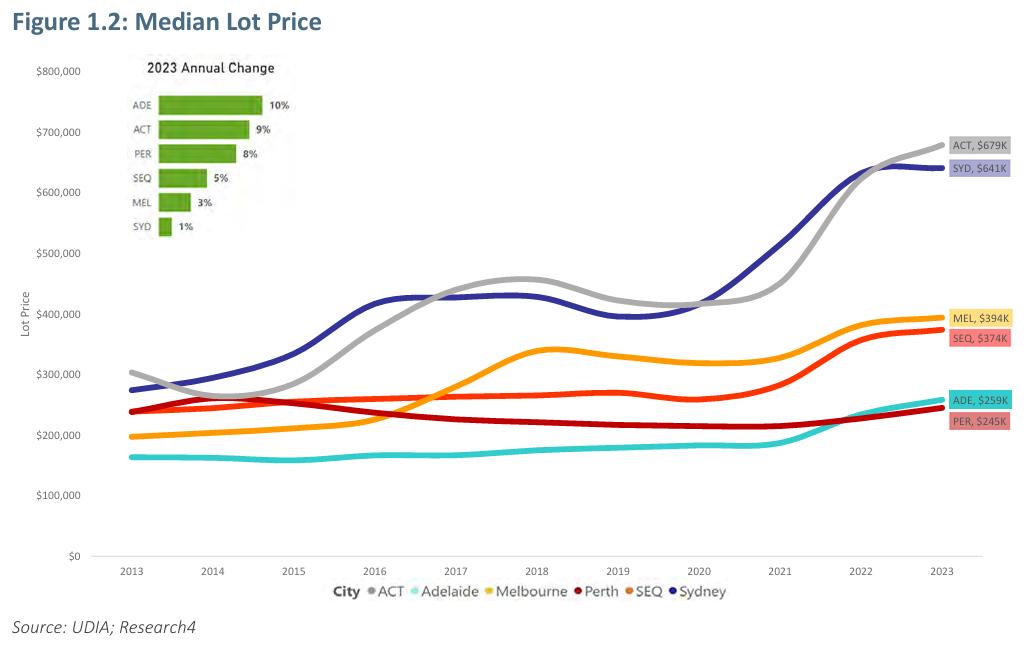
As illustrated below by Urban Development Institute of Australia, all major capitals experienced significant land cost inflation over the past decade:
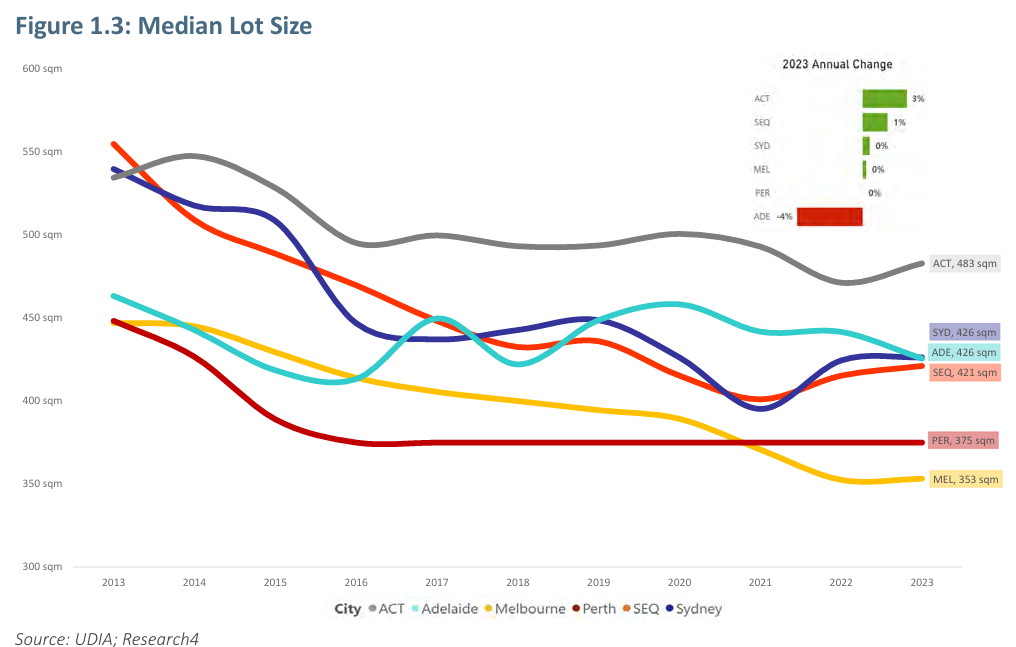
This rise in median lot prices has occurred in spite of lot sizes shrinking:
The rising cost of land across Australia is one of the barriers to Australia building more homes for its ballooning population.
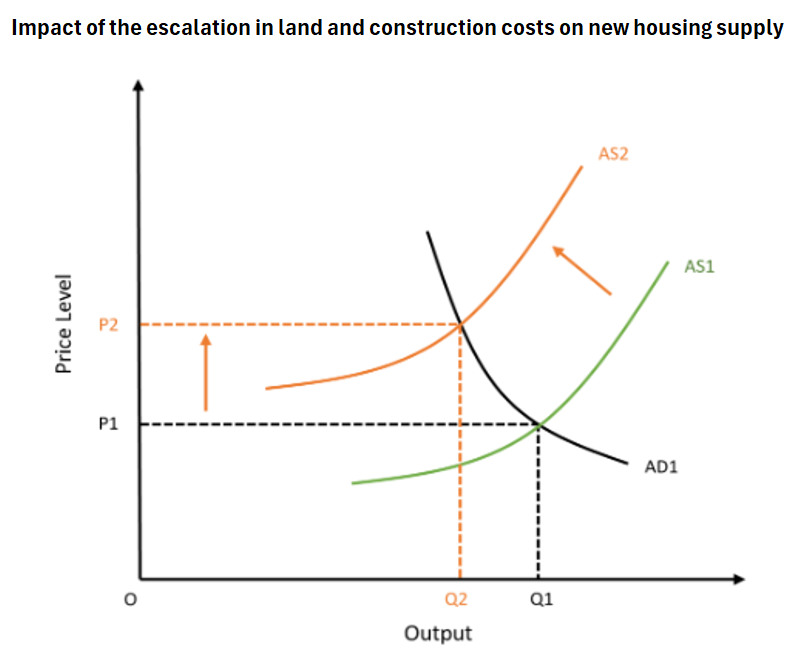
In basic economic terms, this land cost-push inflation has shifted the aggregate supply curve to the left, reducing overall capacity for producing homes at every price tier:
