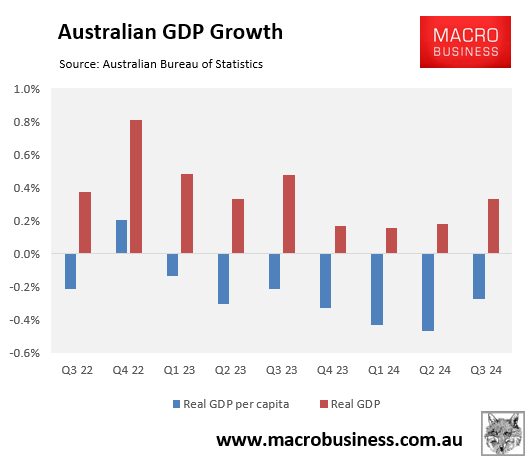
Wednesday’s Q3 national accounts release from the Australian Bureau of Statistics (ABS) revealed that Australia’s per capita recession extended to a record-breaking seventh consecutive quarter after declining by 0.3% in Q3.
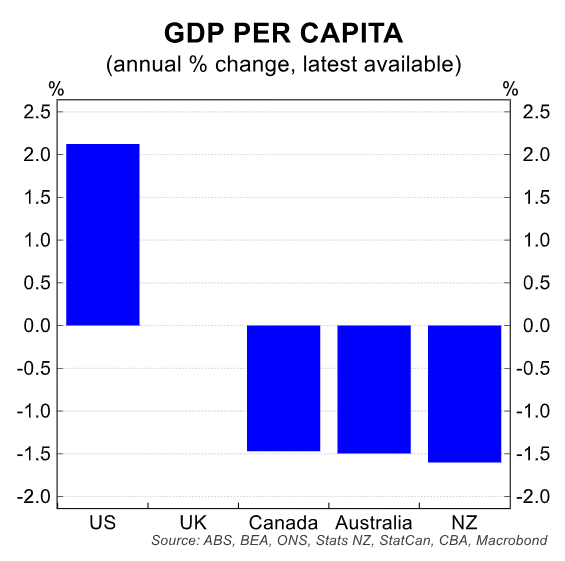
This meant that Australia’s real per capita GDP declined by 1.5% in the year to September 2024, in line with the declines recorded in Canada and New Zealand.
Australia’s real per capita GDP has now declined by 2.1% from its peak in June 2022, when the Albanese Labor government took office.
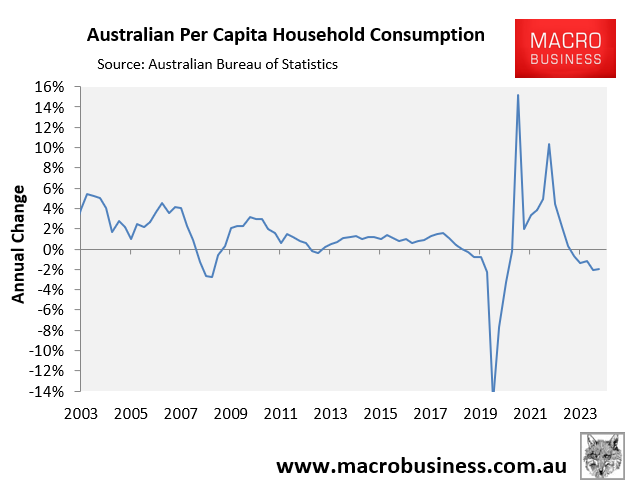
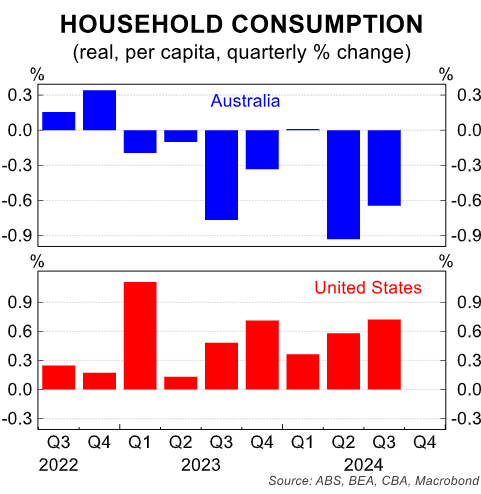
Australian household consumption fell by 1.9% in per capita terms in the year to September, driving the decline in the country’s per capita GDP.
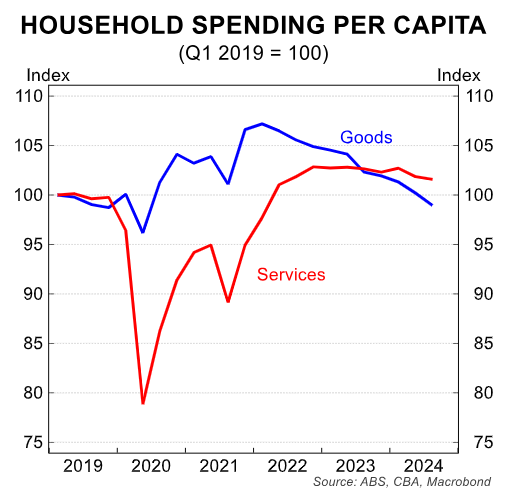
As illustrated below by CBA, the decline in per capita spending has been driven by goods, whereas services spending has flatlined.
CBA also shows that Australian household consumption is exceptionally weak compared to US households where the transmission of monetary policy via the cash flow channel is significantly muted because almost all of their mortgages are fixed.
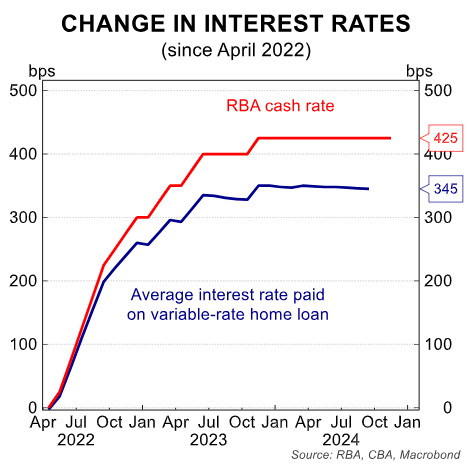
The severe monetary tightening from the Reserve Bank of Australia (RBA) is clearly detrimental to Australian households.
Although the RBA has not increased the cash rate since November 2023, mortgages continue to roll off ultra-low fixed rates, and the housing credit stock has increased.
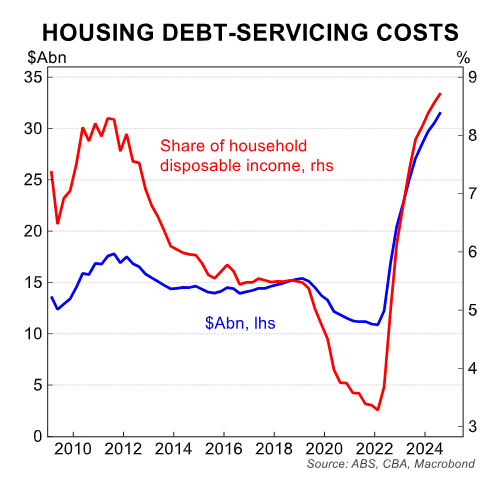
As a result, CBA shows below that housing debt servicing costs continue to increase, both in dollar terms and as a share of income.
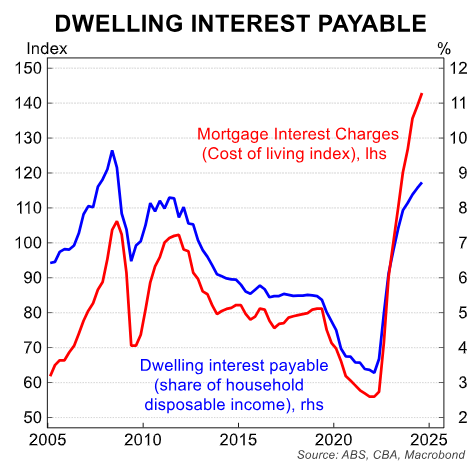
Interest payments, therefore, remain a significant weight on household disposable income. Growth in the interest payable on dwellings accelerated in the quarter, up 3.4% over Q3 from 2.8% in Q2.
The only upside for households in the Q3 national accounts is that the Stage 3 tax cuts provided a modest 0.2% boost to household disposable incomes, although it remained 0.1% lower over the year.
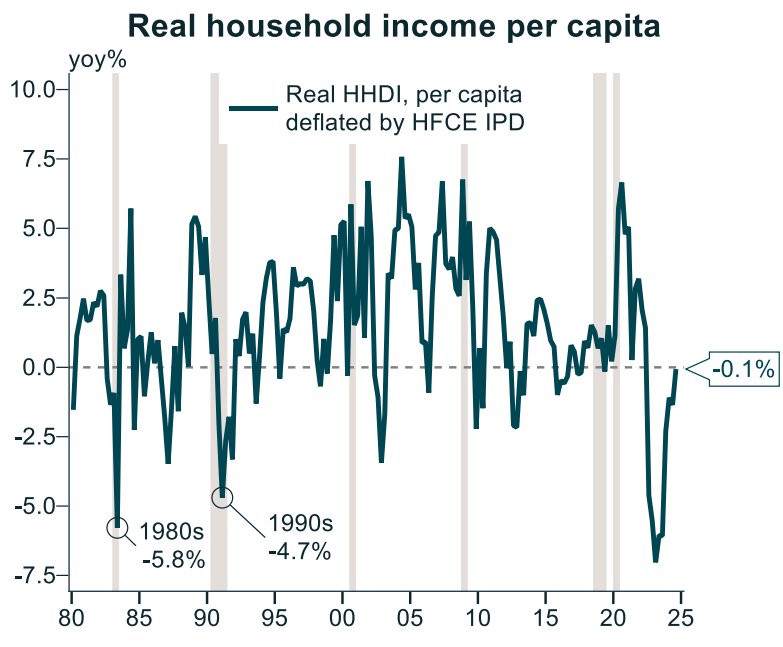
Source: Alex Joiner (IFM Investors)
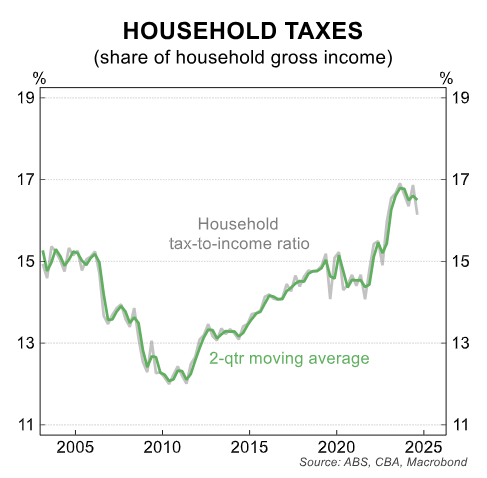
Household taxes as a share of household gross income fell to 16.1% in Q3 24, the lowest since Q4 22. However, the Parliamentary Budget Office projects that this ratio will resume its upward trend.
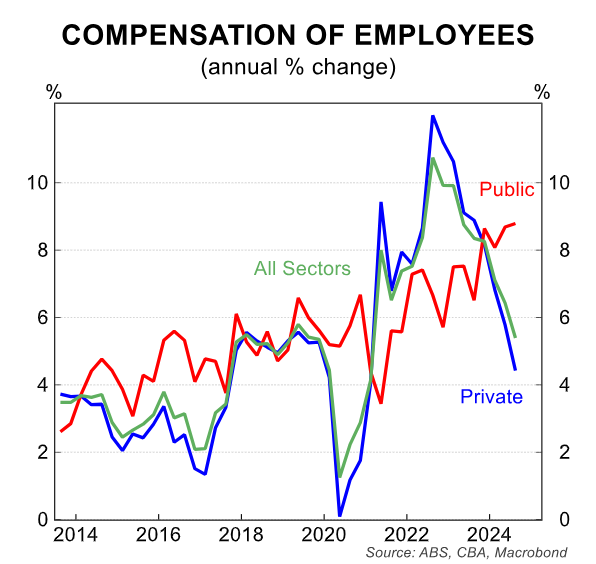
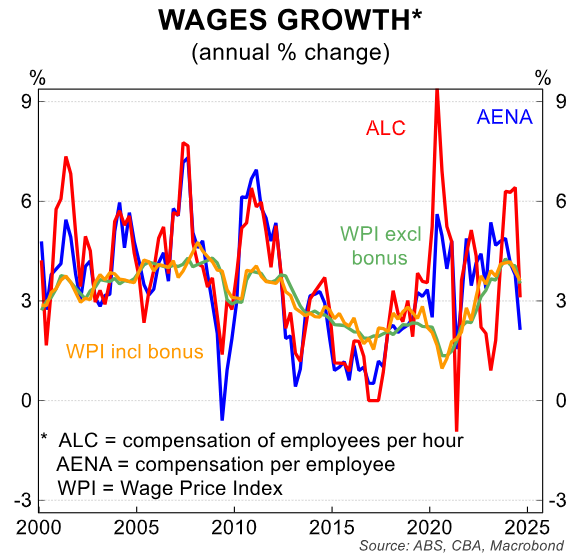
Finally, the following charts from CBA show that Australian wage growth is trending lower, driven by the private sector.
The annual growth in employee compensation (COE) declined to 5.4% from 6.4% previously and a peak of 10.7%. The private sector wage bill has led the decline.
The fall in COE growth broadly aligns with the aggregate wage growth easing in CBA bank accounts.
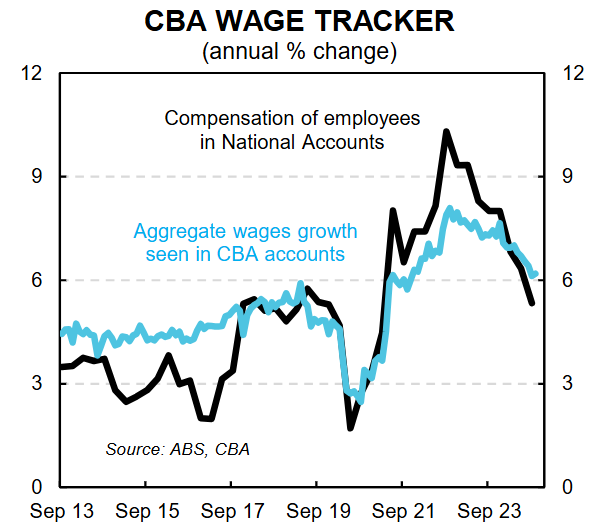
Indeed, various measures of wage growth have fallen over recent quarters.
Overall, the data above depicts a dire situation for Australian households, who are deeply entrenched in recession.

