The Chinese depression is proving to be a real barnstormer. When you can write your own GDP numbers, then why not?
Quarterly GDP was 1.6% and annual 5.2%.
For December, industrial production was cooking at 6.2% year on year. Fixed asset investment was solid 3.2%. And retail sales 3.7%.
Hilariously, the GDP deflator scorched higher to 1.9% despite rampant deflation, delivering quarterly nominal growth of 3.5% or 14% annualised.
In short, the NBS statisticians hit the bong hard last month.
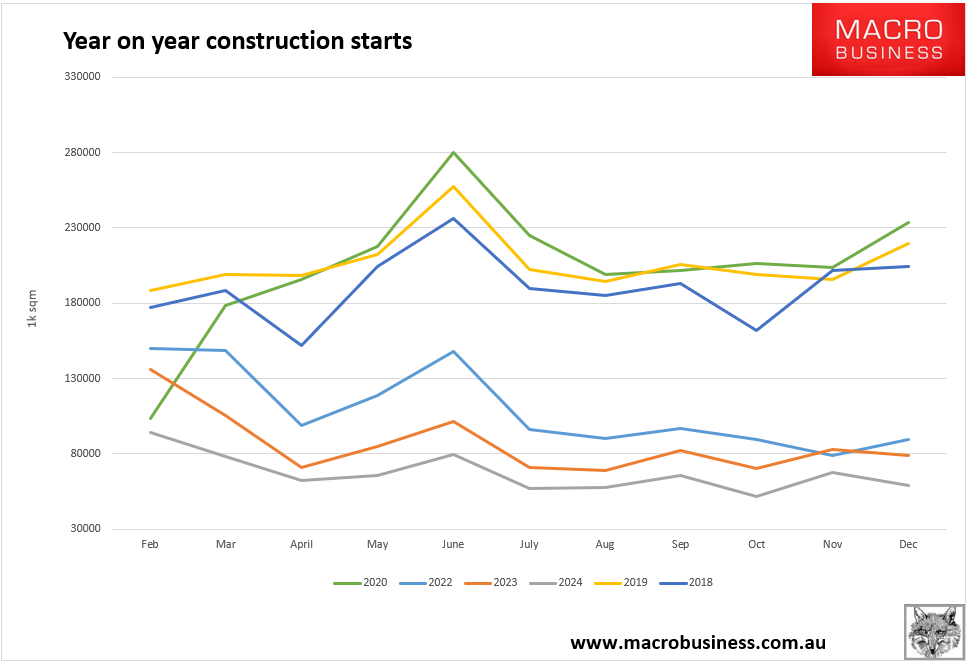
The real estate depression continued, at least, with floor area starts still down 70+%.

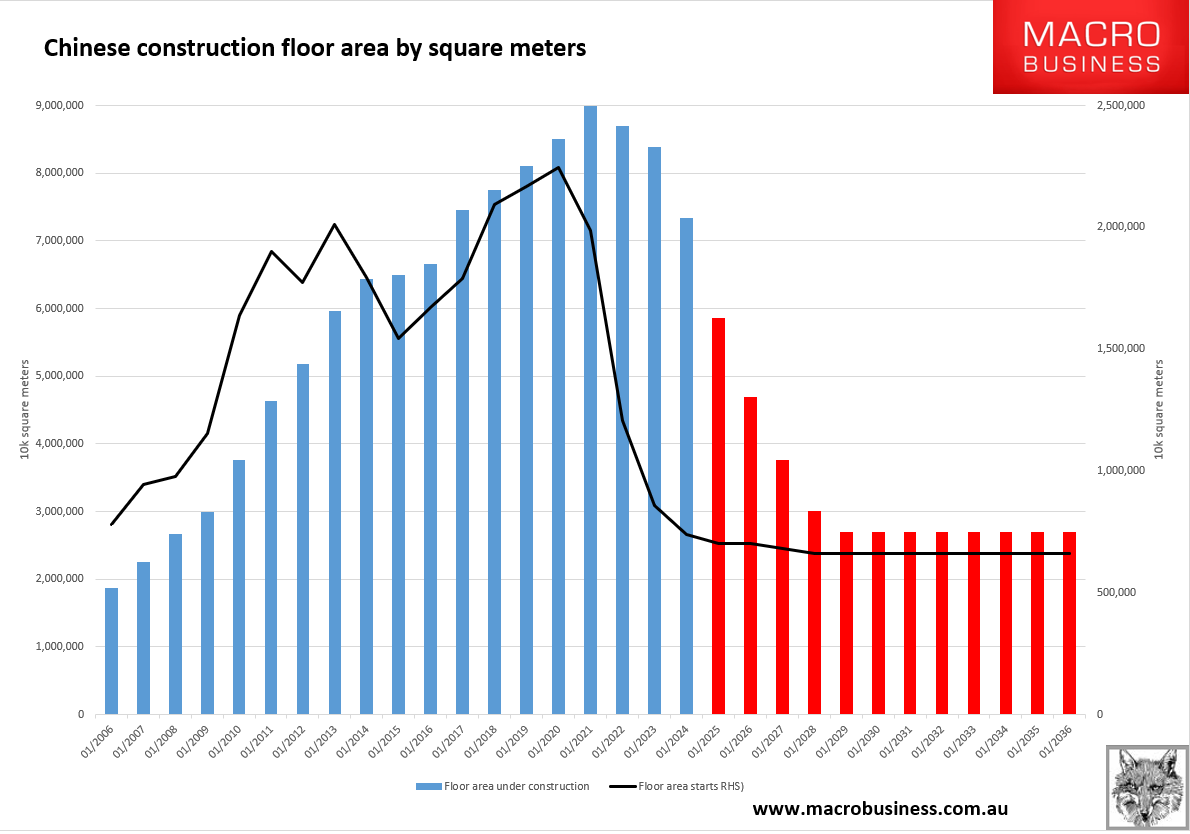
The stock of unfinished and unsold apartments remains immense, so the floor area under construction is down only 20% or so. Massive falls are still ahead.

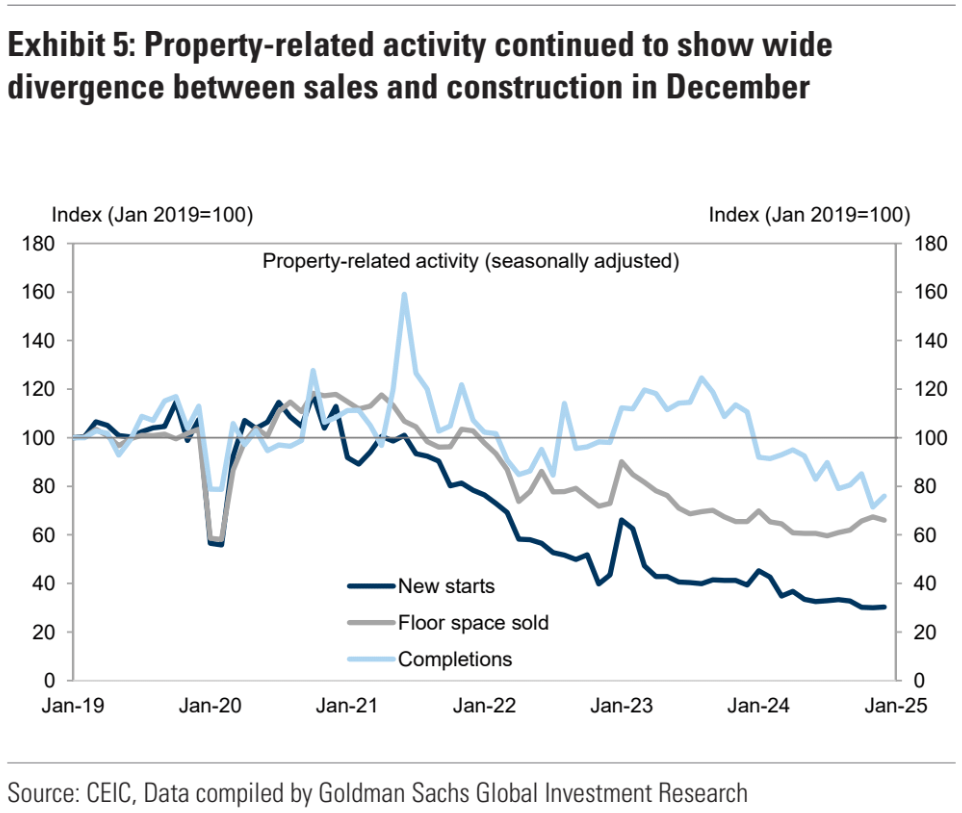
The whole debacle shows up in the gap between completions and starts. This must close.

There is some success in stabilising new home prices. Goldman has more.
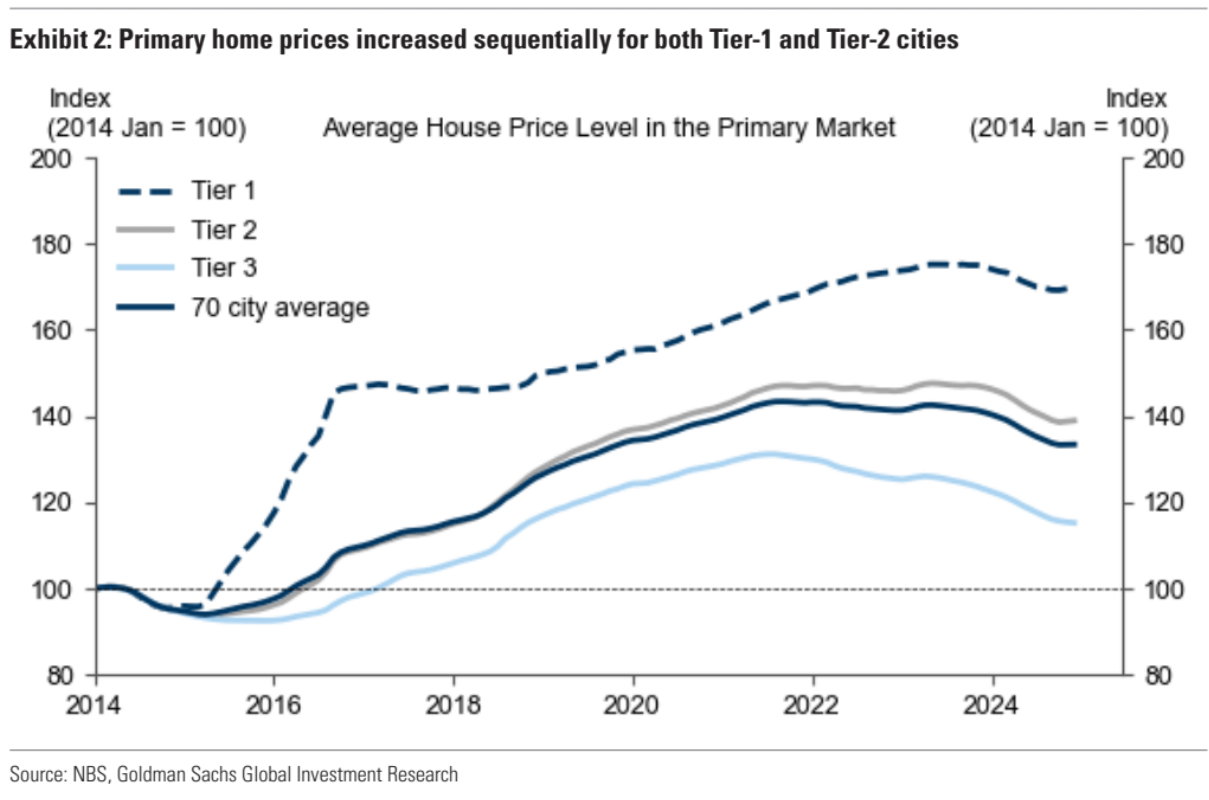
The National Bureau of Statistics’ 70-city house price data suggest the weighted average property price in the primary market increased by 0.5% mom annualized in December after seasonal adjustments.
Both Tier-1 and Tier-2 cities experienced a sequential increase in primary home prices in November.
We emphasize the 70-city data are for primary market transactions (new home sales) only; secondary market data by NBS and some third-party platforms suggest price declines of 5%-15% over the past year.

To be clear, Chinese demand likely lifted in Q4 with consumer trade-in schemes and tariff frontrunning.
But both the degree and sustainability are laughable.

