A surge in European stocks overshadowed what was looking like a good night for Wall Street with only tech stocks lifting higher as the broader indicies keep absorbing the latest USD machinations and speculation around the incoming Trump Circus with the direction of tariffs in particular. The hard time for Chinese equity markets continued in yesterday’s session but equity futures are suggesting a lift on the open for the ASX200 while the Australian dollar finally broke through of its recent dour trajectory with a breakout above the 62 cent level.
US Treasury yields were pushed higher again across the board with the 10 year breaking the 4.6% level while oil markets are holding on to their move higher as Brent crude stayed above the $76USD per barrel level at a new weekly high. Gold pulled back slightly again as it stayed below the $2640USD per ounce level.
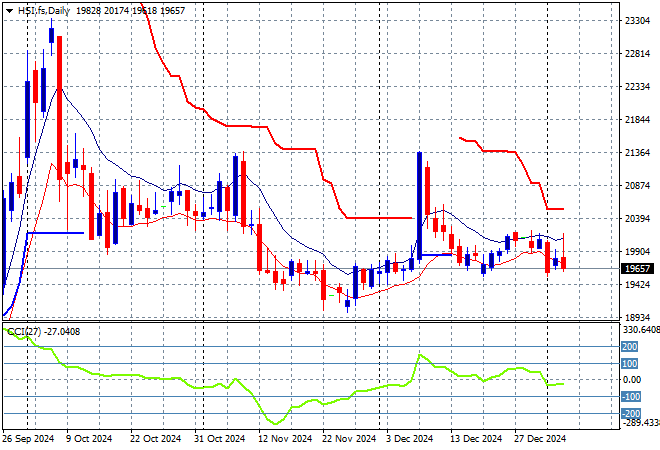
Looking at stock markets from Asia in yesterday’s session, where mainland Chinese share markets are still looking weak as they slide lower into the afternoon session with the Shanghai Composite down more than 0.5% to push below the 3200 point level while the Hang Seng Index has lost a similar amount at 19661 points.
The Hang Seng Index daily chart shows how resistance formed around the 21000 point level with only one false breakout in late November squashed back to the 20000 point level where price action has stayed since. This is still setting up for another potential breakdown here:
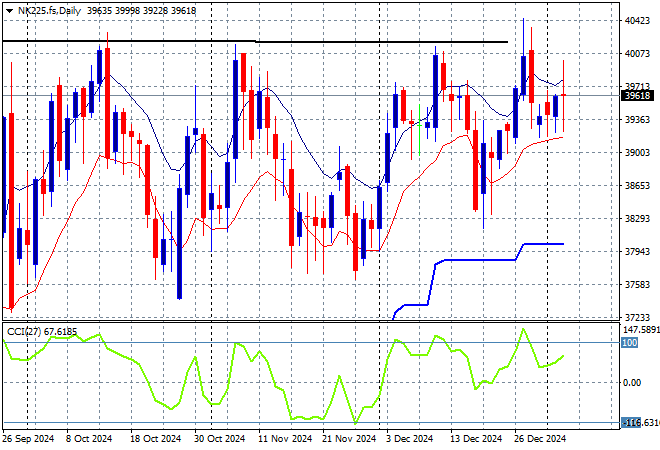
Japanese stock markets are playing catchup as they reopen from the NY break with the Nikkei 225 closing more than 1.3% lower at 39349 points.
Price action had been indicating a rounding top on the daily chart with daily momentum retracing away from overbought readings with the breakout last month above the 40000 point level almost in full remission. Yen volatility remains a problem here, with a sustained return above the 38000 point level from May/June possibly on the cards as positive momentum is building:
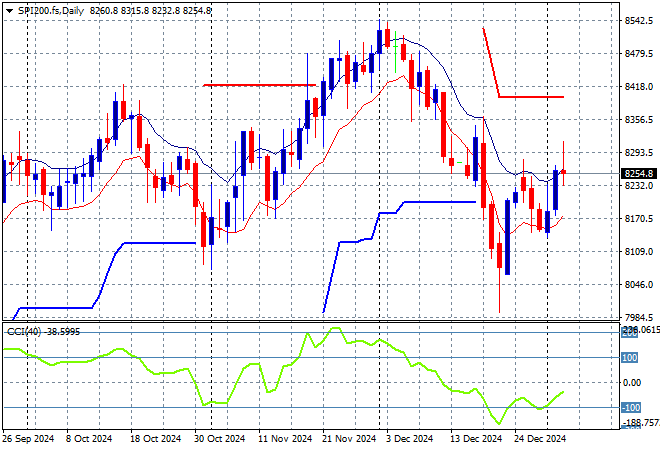
Australian stocks are again the best performing in the region but only by default with the ASX200 putting in a scratch session to close at 8257 points.
SPI futures are barely changed despite the rebound session on Wall Street overnight. The daily chart pattern and short price action suggests this rollover has built a little too much momentum to the downside even if support at the 8400 point level was illusory indeed. The dead cat bounce may repeat here so watch out for any falls below 8200 points:
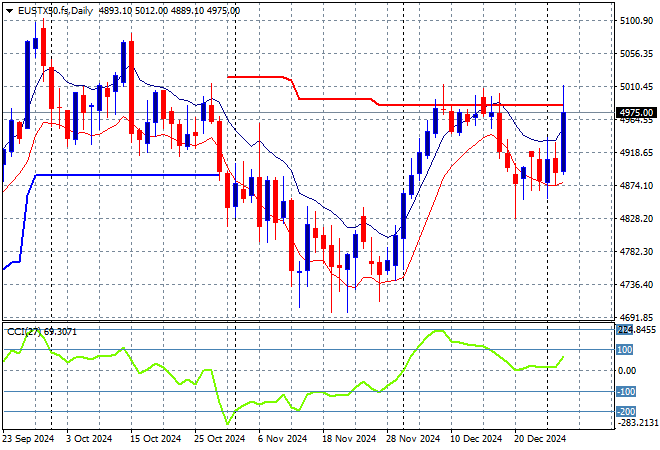
European markets surged strongly overnight with big moves higher across the continent with the Eurostoxx 50 Index closing 2.3% higher at 4986 points.
This was looking to turn into a larger breakout with support at the 4900 point level quite firm with resistance again unable to breach the 5000 point barrier. Price had previously cleared the 4700 local resistance level as it seeks to return to the previous highs but momentum has pick up strongly here with the 4900 point level turning into strong support:
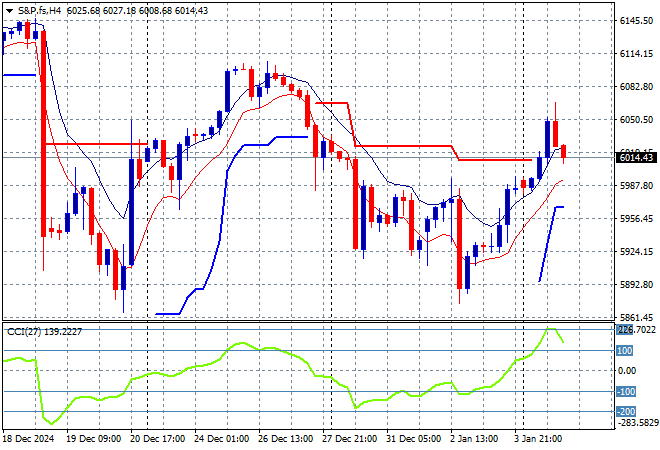
Wall Street is trying harder to get out of its recent funk and the weird start to the year, led this time by the NASDAQ which pushed more than 1.2% higher while the S&P500 only lifted some 0.3% to finish at 5964 points.
Short term price action looks somewhat ominous but never discount the bottom pickers to get this back on track with a potential rebound off the 5900 point support zone:
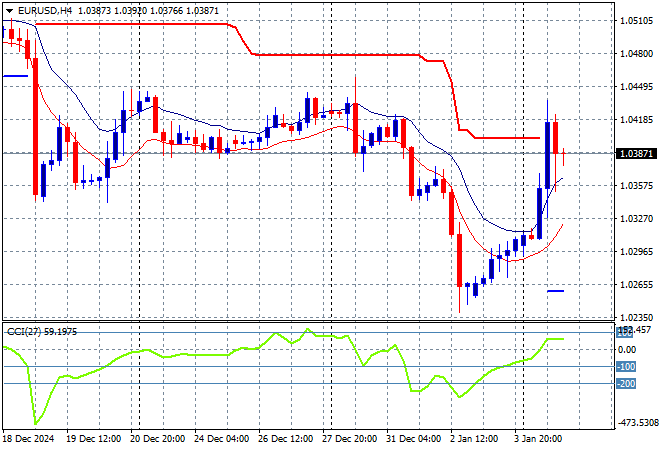
Currency markets remain in the thrall of King Dollar but the slightly stronger ISM saw USD pull back later in the session as Euro bounced back above the 1.03 handle, after retreating below the December low earlier in the week.
Despite the rebound this all still fits in with my contention that we are still likely on our way back to parity as traders start to price in the now very unclear future for the continent. The union currency is now making new lows and will likely slide further towards parity:
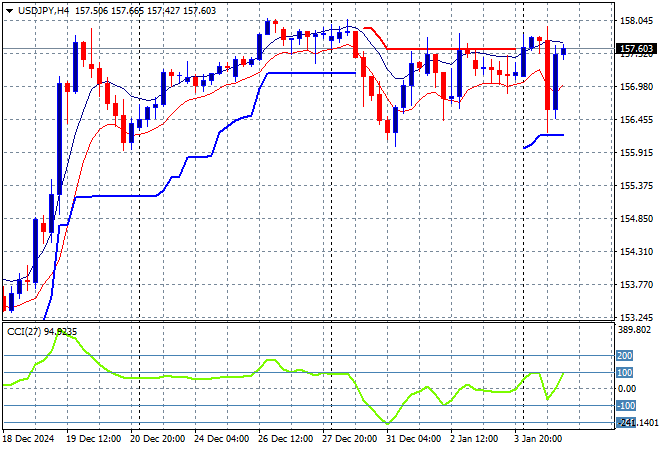
The USDJPY pair was unable to move due to a lack of trading volume holding just above the 157 handle where it stayed post NY as this does look a little bit toppy overall.
Short term momentum has reverted out of extremely overbought settings but is still very positive indeed as price action settles down but there is still potential for more upside here dependent on trading activity as the new year begins:
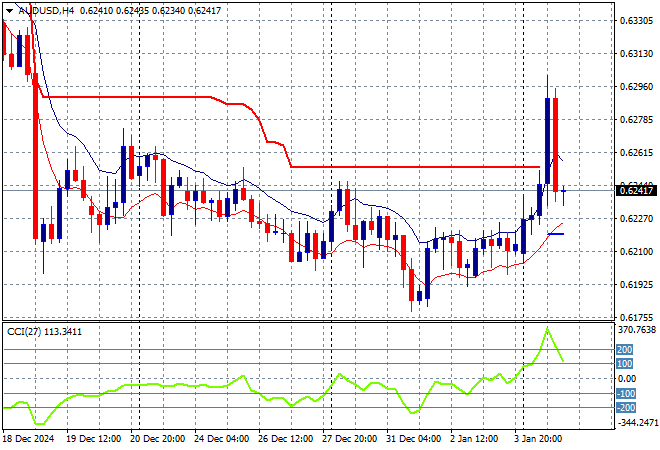
The Australian dollar remains one of the most depressed undollars with the very weak fightback before Xmas turning into nothing sustainable as it loses traction above the 62 handle.
This breakdown has been on the cards for weeks and will reverberate into the new year as the currency finally reweights according to its position in the global economy – lower tier. Watch for overhead ATR resistance on the four hourly chart to be rejected again:
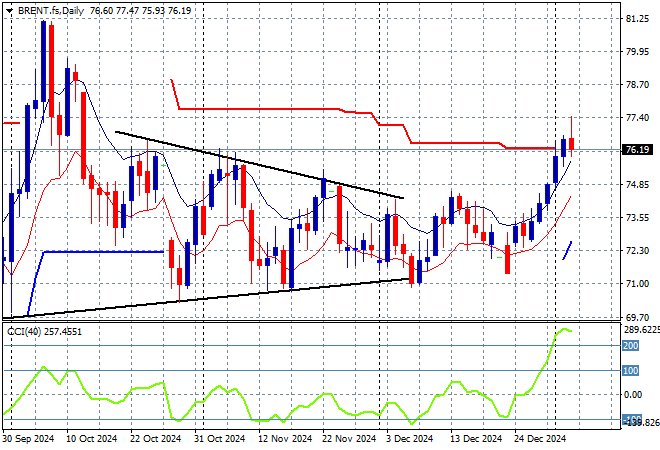
Oil markets are doing well to re-engage post the OPEC meeting as Brent crude gets out of its depressed mood around the $72-73USD per barrel level, holding above the $76 level that it broke through on Friday night.
The daily chart pattern has broken out of its spring formation with short term momentum bursting into overbought territory but a run up to the $80 level is not yet confirmed:
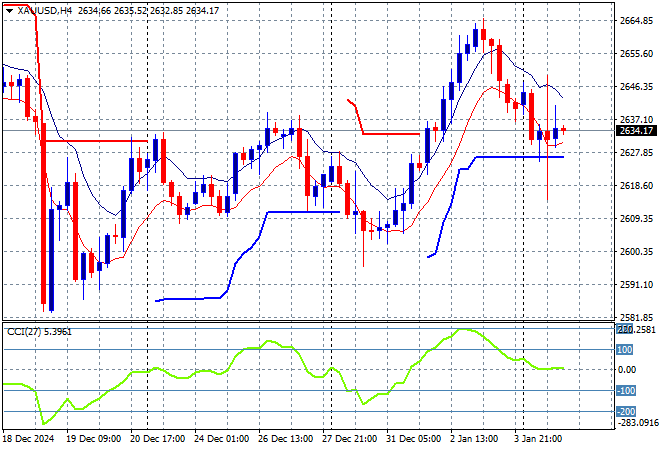
Gold continues to suffer while other undollars move forward and while it has maintained a sustained return above the $2600USD per ounce level, the mild retracement from last Friday night has continued as it stalls at the $2630 level.
Price action had been accelerating in confidence in early December as new levels of support were being created regardless of USD strength but this pullback and rebound both had been fighting too much under the $2700 zone so I have been skeptical of any upside potential:
Glossary of Acronyms and Technical Analysis Terms:
ATR: Average True Range – measures the degree of price volatility averaged over a time period
ATR Support/Resistance: a ratcheting mechanism that follows price below/above a trend, that if breached shows above average volatility
CCI: Commodity Channel Index: a momentum reading that calculates current price away from the statistical mean or “typical” price to indicate overbought (far above the mean) or oversold (far below the mean)
Low/High Moving Average: rolling mean of prices in this case, the low and high for the day/hour which creates a band around the actual price movement
FOMC: Federal Open Market Committee, monthly meeting of Federal Reserve regarding monetary policy (setting interest rates)
DOE: US Department of Energy
Uncle Point: or stop loss point, a level at which you’ve clearly been wrong on your position, so cry uncle and get out/wrong on your position, so cry uncle and get out!