Wall Street returned from its long weekend and rallied across the board, not helped by more tariff talk although most of that looks like the typical hot air so far, with the USD still remaining in a weak short term cycle against the major currency pairs. European shares were flat as the lift in Euro starts to weigh on risk as the union currency remains above the 1.04 handle while Yen remained somewhat firm. Meanwhile the Australian dollar also made some inroads and is finally sticking back above the 62 cent level.
US bond markets reopened with 10 year Treasury yields falling back 5 points to the 4.5% level while trading in oil was subdued with Brent crude retracing back below the $80USD per barrel level. Gold also advanced strongly above the $2700USD per ounce level after being in a holding pattern.
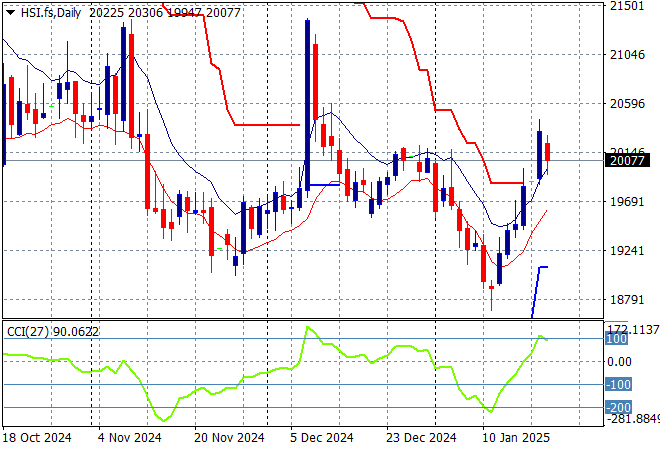
Looking at stock markets from Asia in yesterday’s session, where mainland Chinese share markets are moving slightly lower in afternoon trade with the Shanghai Composite down 0.3% or so as it remains slightly above the 3200 point level while the Hang Seng Index is up 0.8% to stay just above the 20000 point level.
The Hang Seng Index daily chart shows how resistance formed around the 21000 point level with only one false breakout in late November squashed back to the 20000 point level where price action has stayed since. This was setting up for another potential breakdown here as price oscillated downward but has turned into an impressive bounce – can it be maintained?
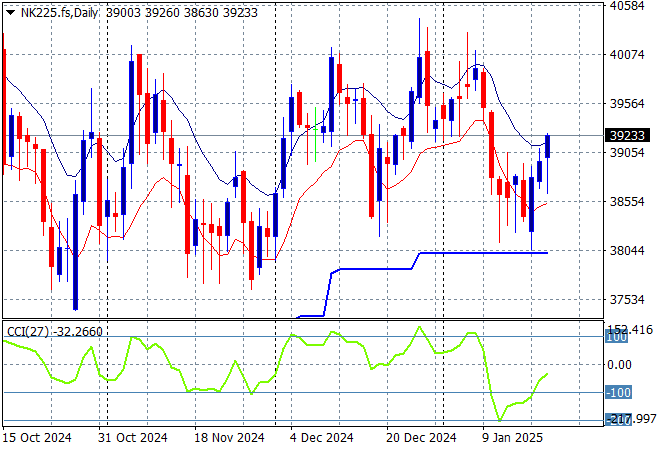
Japanese stock markets are still uneasy due to the higher Yen with the Nikkei 225 closing just 0.1% higher at 38945 points.
Price action had been indicating a rounding top on the daily chart with daily momentum retracing away from overbought readings with the breakout last month above the 40000 point level almost in full remission. Yen volatility remains a problem here, with a sustained return above the 38000 point level from May/June possibly on the cards but resistance is firming:
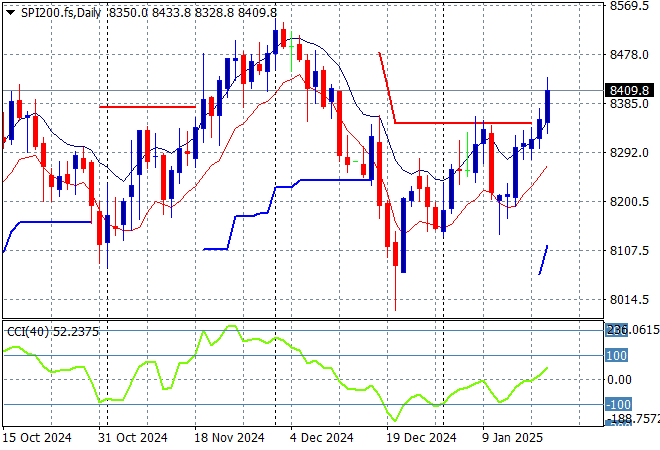
Australian stocks had another solid day across the board with the ASX200 closing some 0.6% higher at 8402 points.
SPI futures are up 0.4% on the solid lead from Wall Street overnight so we could see a continuation breakout pattern here today. The daily chart pattern and short price action suggests continued moves above resistance overhead at the 8300 point level:
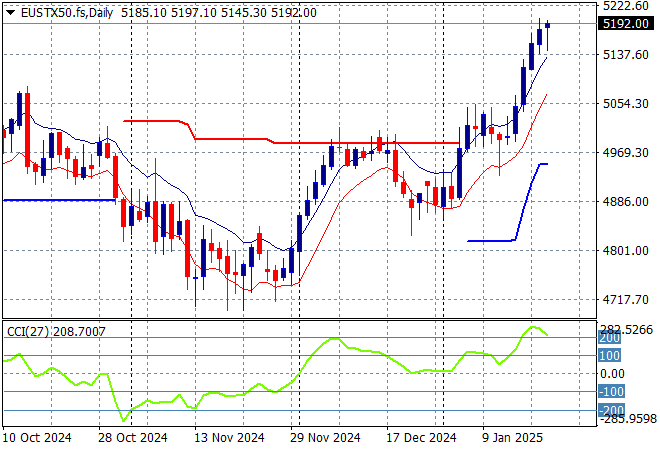
European markets were unable to make any serious gains across the continent as the Eurostoxx 50 Index slowed down its advance, closing just 0.1% higher to remain well above the 5100 point level, finishing at 5164 points.
This was looking to turn into a larger breakout with support at the 4900 point level quite firm with resistance unable to breach the 5000 point barrier in recent months. Price had previously cleared the 4700 local resistance level as it seeks to return to the previous highs as momentum tries to pick up strongly here with the 4900 point level turning into strong support:
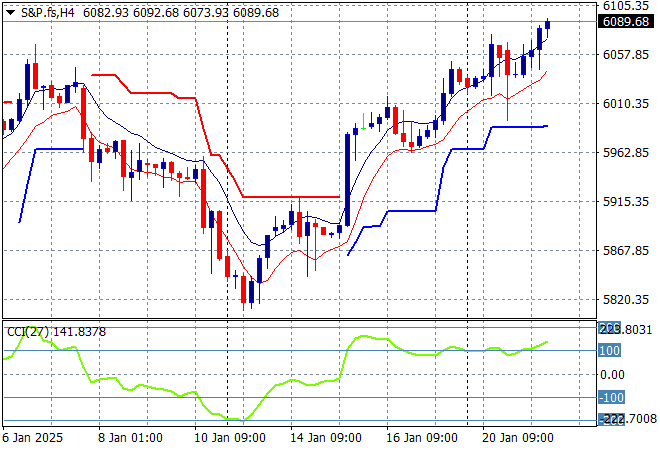
Wall Street reopened after the long weekend holiday with both the NASDAQ and S&P500 advancing, the latter pushing more than 0.8% higher to finish at 6049 points.
Short term price action was looking somewhat ominous before Friday night with a triangle pattern and support at the 5900 point collapsing as the bottom pickers stood aside to make a new low but short term resistance has now been cleared with this one off move. The next target to beat is the New Year high as the Trump Circus continues:
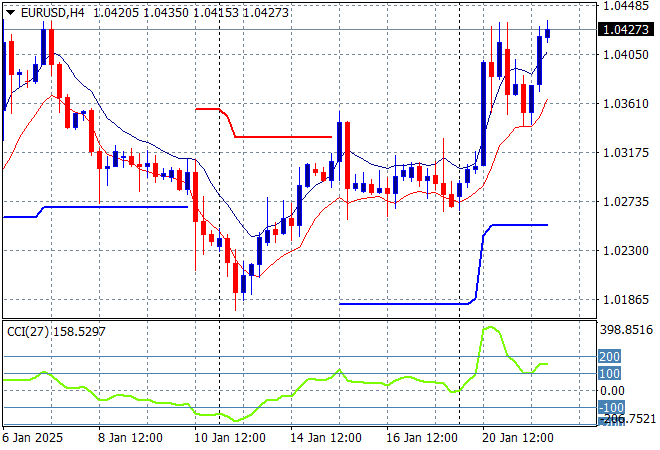
Currency markets had been wavering the strong USD mood before the end of last week with King Dollar still dominating since the most recent NFP print but weakness has again returned despite walking back of tariff talk. Almost all the undollars advanced again with Euro jumping smartly above the 1.04 level and staying there in morning trade.
The union currency was ready to make new lows in a very oversold condition so this isn’t that surprising as markets re-align but this could be more than a short term resolution as the chaotic volatility that is the White House economic “policy” begins:
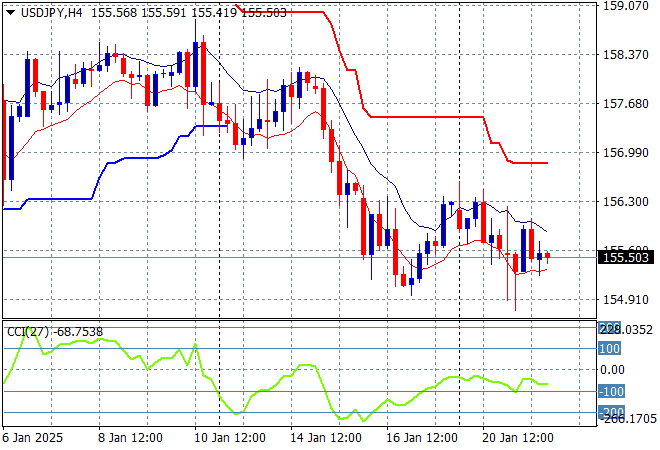
The USDJPY pair was unable to hold on to its Friday night gains remaining well below the 156 handle overnight with Yen firming once more.
Short term momentum has reverted out of extremely overbought settings but is now fully entrenched in negative settings as price seeks the to break below the 155 level but as I warned last week, the potential for a rebound was building here, although it looks to be a dead cat bounce at best:
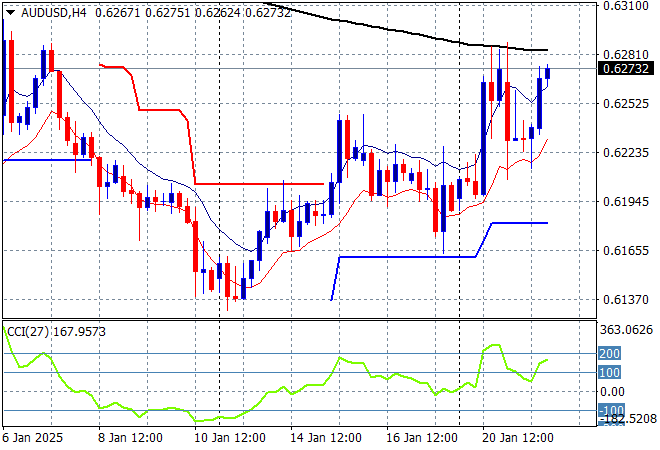
The Australian dollar is still depressed in the medium term but is looking better in the short term completely on USD weakness as it held well above the 62 cent zone overnight.
The potential follow through to the high 62’s as it almost hits the 200 day moving average (upper black sloping line) indicates some chance of a medium term reversal, but this is high risk going into the live February RBA rate meeting – watch for a rejection at just below the 63 cent level instead:
Oil markets couldn’t continue their breakout from Friday night with Brent crude retracing back below the $80USD per barrel level in a continued welcome pullback after being so overbought, finishing just above the $79 level.
The daily chart pattern has broken out of its spring formation with short term momentum bursting into overbought territory with a run up to the $80 level now complete, but needs another breather first as this looks considerably overdone and likely to slip in the coming sessions:

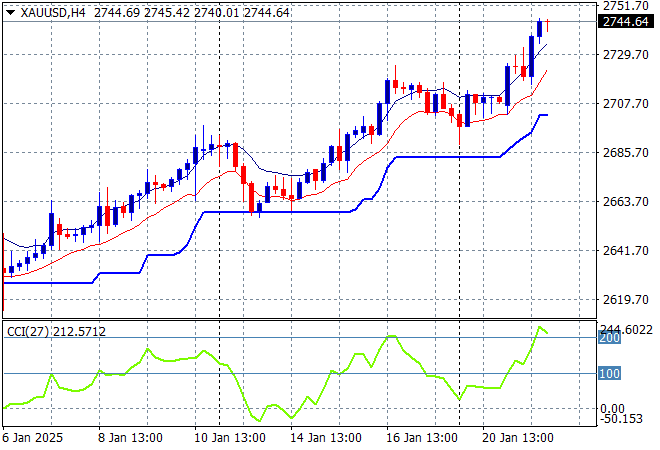
Gold is now well back on track after recently running out of steam as it made further inroads above the $2700USD per ounce level overnight, almost closing above the $2750 level.
Price action had been accelerating in confidence in early December as new levels of support were being created regardless of USD strength but this pullback and rebound both had been fighting too much under the $2700 zone so I have been skeptical of any upside potential. However this is looking more interesting:
Glossary of Acronyms and Technical Analysis Terms:
ATR: Average True Range – measures the degree of price volatility averaged over a time period
ATR Support/Resistance: a ratcheting mechanism that follows price below/above a trend, that if breached shows above average volatility
CCI: Commodity Channel Index: a momentum reading that calculates current price away from the statistical mean or “typical” price to indicate overbought (far above the mean) or oversold (far below the mean)
Low/High Moving Average: rolling mean of prices in this case, the low and high for the day/hour which creates a band around the actual price movement
FOMC: Federal Open Market Committee, monthly meeting of Federal Reserve regarding monetary policy (setting interest rates)
DOE: US Department of Energy
Uncle Point: or stop loss point, a level at which you’ve clearly been wrong on your position, so cry uncle and get out/wrong on your position, so cry uncle and get out!