
Risk markets are starting to diverge in fortuned once more as Wall Street and European shares continue their bounceback while commodities remain in flux due to the Chinese tariffs. Meanwhile the USD is weakening again as there is growing speculation the Fed may have more easing in its cycle as King Dollar struggles against Yen and Euro. The Australian dollar is now in a much stronger position to almost cross the 63 cent level after almost crashing below the key 60 handle at the start of the week gap action.
10 year Treasury yields pulled back again, down nearly 7 points to the 4.4% level while trading in oil was volatile with both markers dropping nearly 3% as Brent crude finished below the $75USD per barrel level. Gold continued its push higher but gave back some late gains to be at the $2860USD per ounce level.
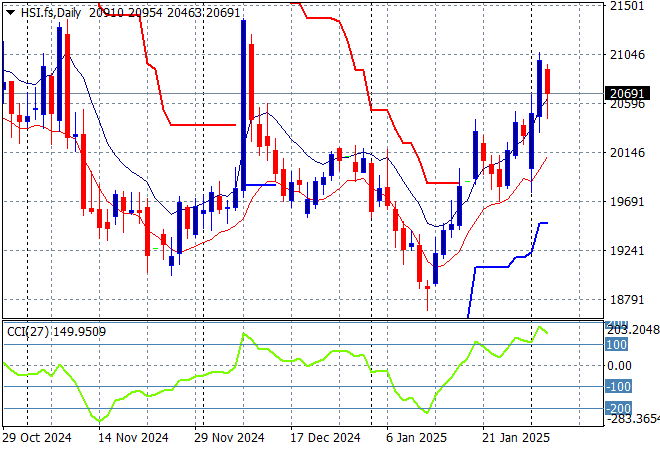
Looking at stock markets from Asia in yesterday’s session, where mainland Mainland Chinese share markets have returned from their New Year holidays with the Shanghai Composite down just 0.6% after absorbing the tariff volatility trade. In Hong Kong, the Hang Seng Index also lost ground, closing more than 1.3% lower to 20527 points.
The Hang Seng Index daily chart shows how resistance formed around the 21000 point level with only one false breakout in late November squashed back to the 20000 point level where price action has stayed since. This was setting up for another potential breakdown here as price oscillated downward but has turned into an impressive bounce and looks like continuing as markets reopen:
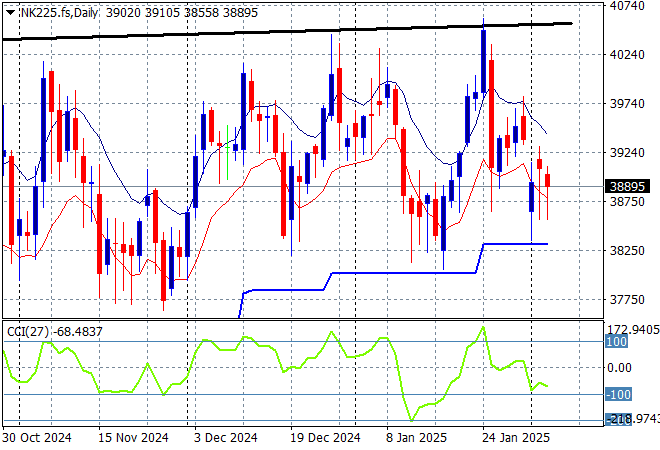
Japanese stock markets were steady after their recent bounceback as the higher Yen weighed, with the Nikkei 225 finishing nearly 0.2% higher at 38826 points.
Price action had been indicating a rounding top on the daily chart with daily momentum retracing away from overbought readings with the breakout last month above the 40000 point level almost in full remission. Yen volatility remains a problem here, with a sustained return above the 38000 point level from May/June possibly on the cards but resistance is firming:
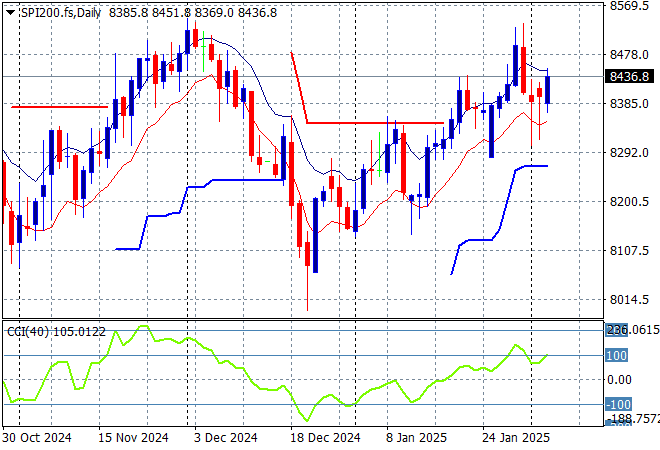
Australian stocks however eventually put in a solid session with the ASX200 closing 0.5% higher at 8416 points.
SPI futures are up 0.7% despite the hit to tech stocks on Wall Street overnight so expect more volatility in today’s session. The daily chart pattern and short price action suggests resistance overhead at the 8300 point level is starting to weigh on the market with a big push through required soon to get back to the 2024 highs with momentum once overbought but now steady:
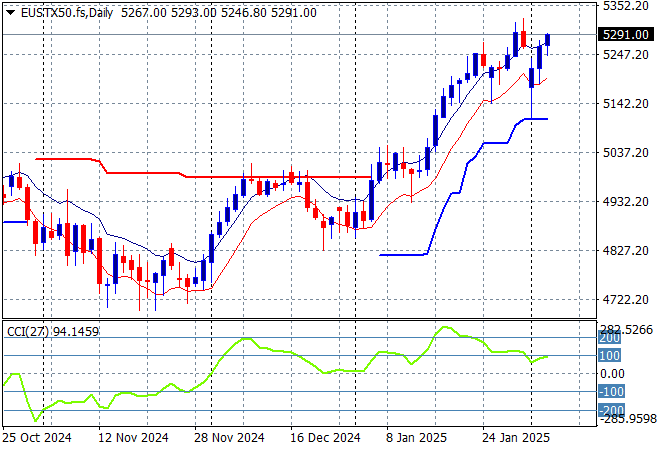
European markets were positive at first but ended up with mixed finishes across most of the continent as the Eurostoxx 50 Index gained just 0.2% to close at 5271 points.
This was looking to turn into a larger breakout with support at the 4900 point level quite firm with resistance unable to breach the 5000 point barrier in recent months. Price had previously cleared the 4700 local resistance level as it seeks to return to the previous highs as momentum tries to pick up strongly here with the 5000 point level turning into very strong support:
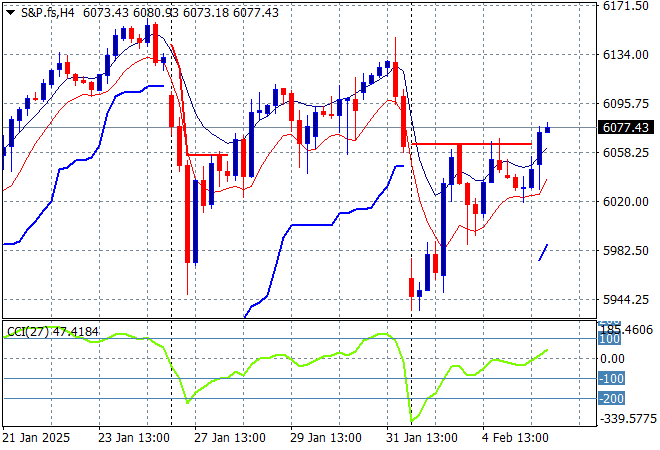
Wall Street’s rebound looked set to continue but tech stocks pulled the NASDAQ back more than 0.2% while the S&P500 lifted just 0.3% to stay above the 6000 point level at 6057 points.
Price action had all the trademarks of a continuation below the 6000 point support level as the potential to overshoot and overreact to the FOMC meeting going into the NFP print this week is building. This should have set up a rally into the 6200 point area but could the first stage of a pump and dump scheme although overhead resistance is weakening:
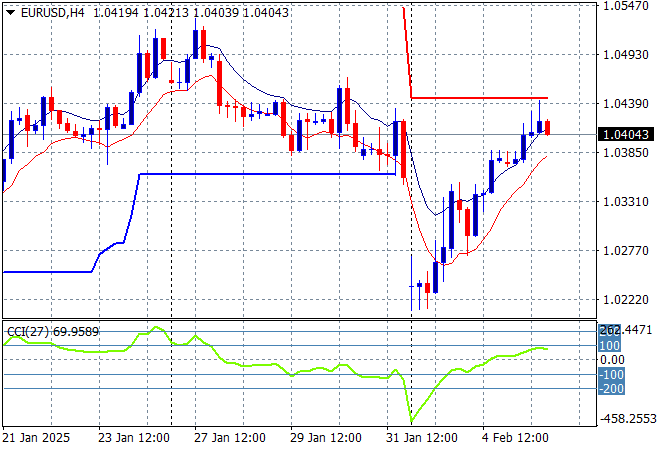
Currency markets have now completed their reversals and have largely absorbed the expected Chinese tariffs with the violent gap downs against most of the undollars now recovered as USD goes back another weakening phase. Euro pushed above the 1.04 level overnight but there are short term signs of exhaustion setting in here before the NFP tomorrow night.
The union currency recently found overhead resistance at the 1.05 handle but has deflated all week before the Friday night slam dunk into the mid 1.03 area as momentum accelerates to the downside. Short and medium term support is still under threat here and requires a significant move higher before calling this over:
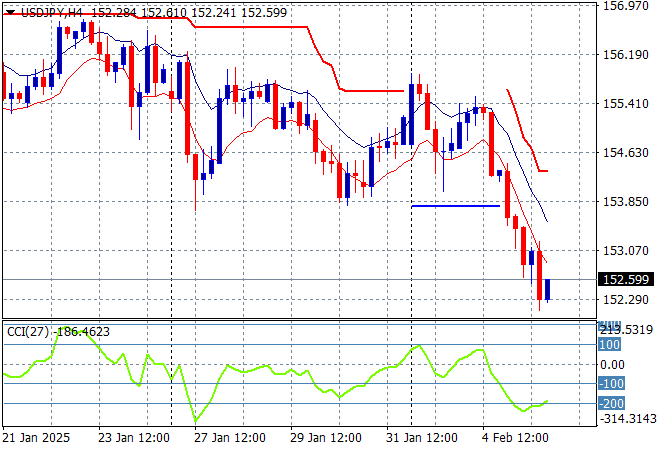
The USDJPY pair had a similar trajectory to the other pairs with Yen firming stronger again overnight with a break below the 153 level this morning before the Tokyo open.
Short term momentum was extremely oversold before the start of week bounce but requires price action to at least get over the 156 level to call this a proper trend higher for USD and this hasn’t come to pass as USD weakens structurally overall:
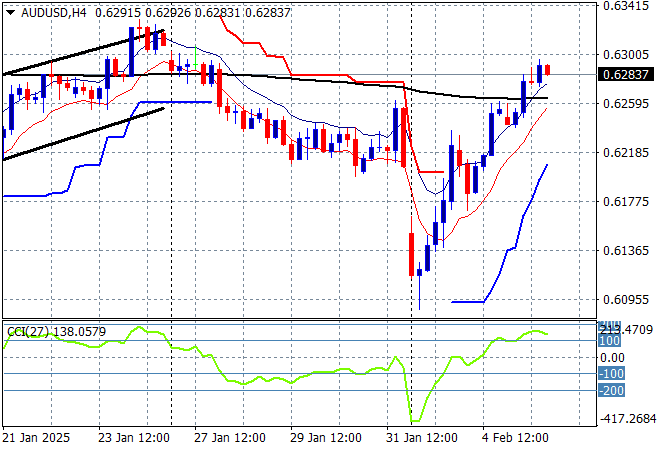
The Australian dollar was one of the biggest casualties of the trade war as the Pacific Peso gapped down to the 60 handle but has now shot higher than its Friday night finish to almost cross the 63 level this morning.
The recent follow through to the high 62’s and low 63’s was always high risk going into the live February RBA rate meeting and after the Trumpian tariff crusade so watch for a rejection of medium term support at the mid 61 cent level although this bounceback could shot over the 200 day MA (moving black line):
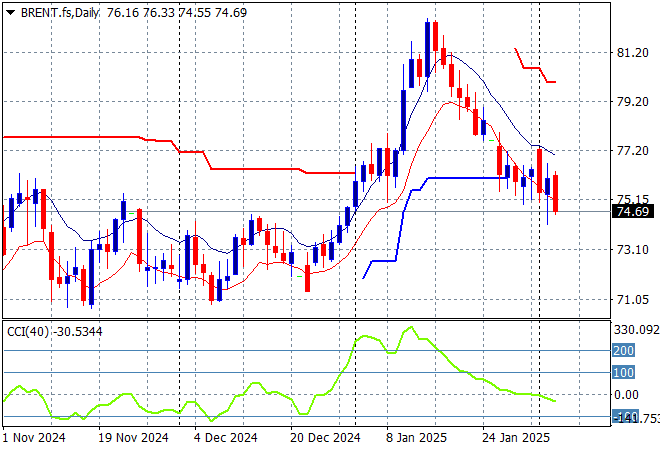
Oil markets are now in flux due to the energy war with China as both WTI and Brent crude had selloffs, the latter finishing well below the $75USD per barrel level with support too weak to hold back the selling tide.
The daily chart pattern shows the post New Year rally that got a little out of hand and now reverting back to the sideways action for the latter half of 2024. The potential for a new rally to form above the $77USD per barrel level from here is dwindling as recessionary fears mount:
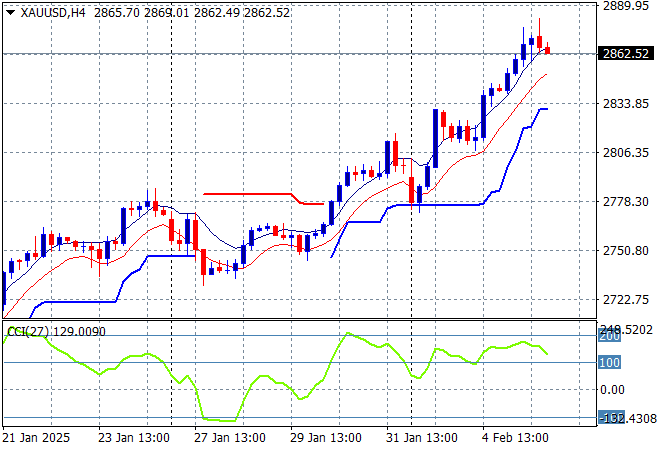
Gold however remains on track after recently running out of steam trying to breach the $2800USD per ounce level last week with an extended run above that level to almost the $2890 level in overnight trade before paring back slightly this morning.
Price action had been accelerating in confidence in early December as new levels of support were being created regardless of USD strength but this pullback and rebound both had been fighting too much under the $2700 zone so I have been skeptical of any upside potential. However this is looking more interesting as the previous weekly high is now surpassed although momentum is quite overbought:
Glossary of Acronyms and Technical Analysis Terms:
ATR: Average True Range – measures the degree of price volatility averaged over a time period
ATR Support/Resistance: a ratcheting mechanism that follows price below/above a trend, that if breached shows above average volatility
CCI: Commodity Channel Index: a momentum reading that calculates current price away from the statistical mean or “typical” price to indicate overbought (far above the mean) or oversold (far below the mean)
Low/High Moving Average: rolling mean of prices in this case, the low and high for the day/hour which creates a band around the actual price movement
FOMC: Federal Open Market Committee, monthly meeting of Federal Reserve regarding monetary policy (setting interest rates)
DOE: US Department of Energy
Uncle Point: or stop loss point, a level at which you’ve clearly been wrong on your position, so cry uncle and get out/wrong on your position, so cry uncle and get out!