
Stock markets are essentially ignoring Trump’s tariff plans and keep heading higher across both sides of the Atlantic with an expectation of that positivity flowing over here in Asia for the last trading day of the week. The latest PPI data saw the USD give up ground against most of the undollars with a violent swing back to Yen strength while the Australian dollar is pushing through the 63 cent level as traders continue to weigh up next week’s long awaited RBA meeting.
10 year Treasury yields tumbled nearly 10 points on the PPI and tariff “roadmap” nonsense swinging back down to the 4.5% level while trading in oil was muted but weak as Brent crude steadied at the $75USD per barrel level. Gold has again pushed through to a new record high above the $2900USD per ounce level – is $3000 next?
Looking at stock markets from Asia in yesterday’s session, where mainland Chinese share markets were at first up but then reversed in afternoon trade with the Shanghai Composite losing nearly 0.5% at the close as did the Hang Seng Index which was up more than 2% at one stage before receding 0.2% to close at 21814 points.
The Hang Seng Index daily chart shows how resistance formed around the 21000 point level with only one false breakout in late November squashed back to the 20000 point level where price action has stayed since. This was setting up for another potential breakdown here as price oscillated downward but has turned into an impressive bounce and looks like continuing as markets reopened after the NY break with the previous monthly highs at the 21500 point now beaten:

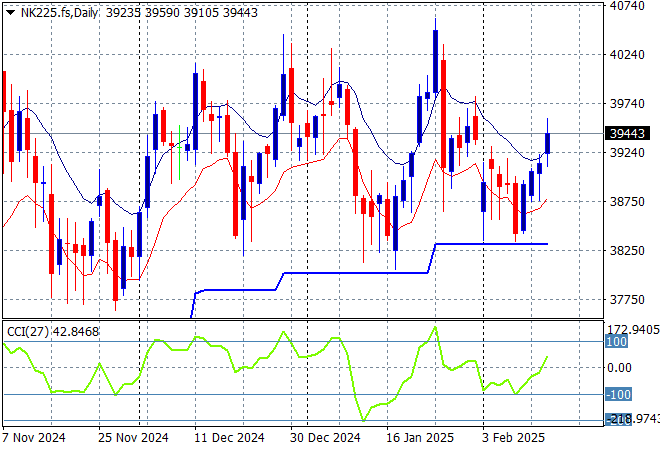
Japanese stock markets however had a proper surge with the Nikkei 225 up 1.4% to finish at 39461 points.
Price action had been indicating a rounding top on the daily chart with daily momentum retracing away from overbought readings with the breakout last month above the 40000 point level almost in full remission. Yen volatility remains a problem here, with a sustained return above the 38000 point level from May/June the support level that must be supported for another run higher:
Australian stocks failed to ignite with a dead flat finish for the ASX200 which closed at 8484 points.
SPI futures however are up nearly 1% due to the strong finish on Wall Street overnight. The daily chart pattern and short price action suggests resistance overhead at the 8300 point level is starting to weigh on the market with a big push through required soon to get back to the 2024 highs. I’m a bit concerned about those negative candlesticks going into the RBA meeting but watch out for a breakout here as Trump’s bluff is called yet again:

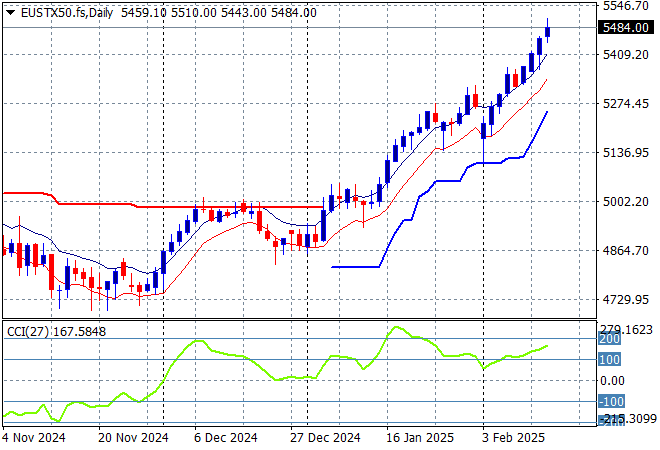
European markets continue to do a lot better than expected with a solid run higher across most of the continent as the Eurostoxx 50 Index gained more than 1.7% to close at 5500 points.
This was looking to turn into a larger breakout with support at the 4900 point level quite firm with resistance unable to breach the 5000 point barrier in recent months. Price had previously cleared the 4700 local resistance level as it seeks to return to the previous highs as momentum picks up strongly here with the 5000 point level turning into very strong support:
Wall Street finally made some decent runs after being quite wobbly as the NASDAQ lifted 1.5% on Meta while the S&P500 almost gained 1% to close at 6111 points.
Price action had all the trademarks of a continuation below the 6000 point support level as the potential to overshoot and overreact to the FOMC meeting going into the NFP print tonight is building. This should have set up a rally into the 6200 point area but could the first stage of a pump and dump scheme although overhead resistance is weakening:

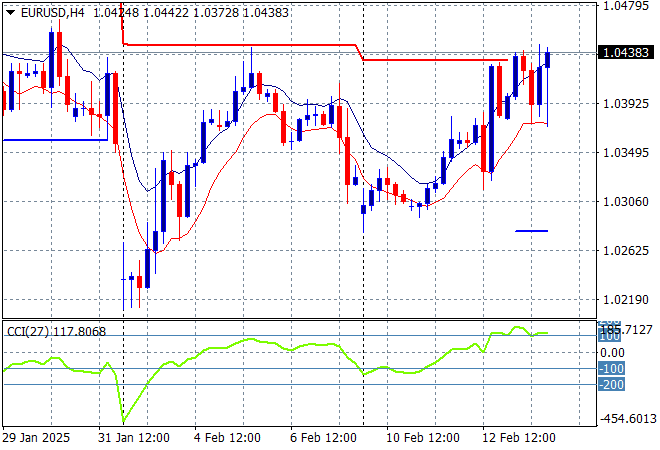
Currency markets had already started to really diverge in fortune with the USD only marginally strong across the board but the hot CPI print overnight gave some volatility across the complex as Euro pushed well above the 1.04 handle before retracing below after looking to threaten overhead resistance at the 1.045 level next as momentum goes overbought in the short term.
The union currency deflated all week before the previous Friday night slam dunk into the mid 1.03 area on the tariff troubles as daily momentum remained to the downside. Short and medium term support is still under threat here and requires a significant move higher or we could see a return to the 1.02 level:
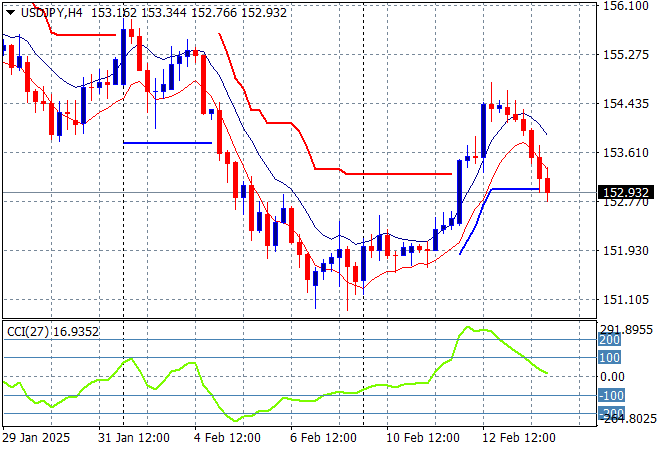
The USDJPY pair tried and failed to get out of its funk with Yen pulling it back to reality overnight after a too fast resurgent move up towards the 154 handle now thwarted back below the 153 level.
Short term momentum was extremely oversold before the start of week bounce but requires price action to at least get over the 156 level to call this a proper trend higher for USD and this hasn’t come to pass as USD weakens structurally overall and domestic policies continue to strengthen Yen:
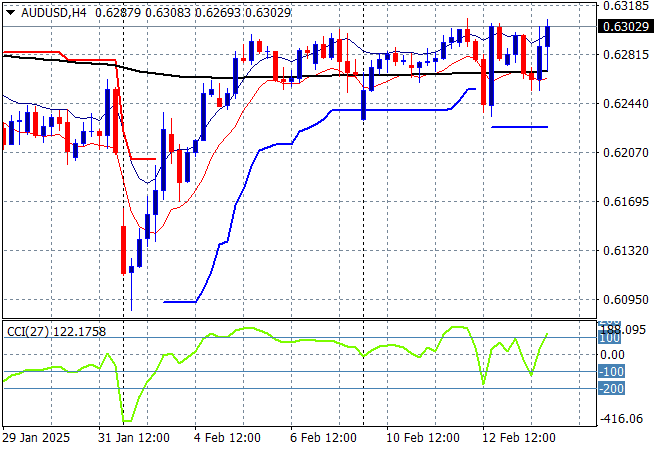
The Australian dollar is surprisingly strong in the wake of continued tariff threats but its really about more USD weakness with volatility around the 63 handle again overnight as short term momentum remains nicely overbought.
The recent follow through to the high 62’s and low 63’s was always high risk going into the live February RBA rate meeting and after the Trumpian tariff crusade although this bounceback could shot over the 200 day MA (moving black line) with a clear inverted head and shoulders pattern:
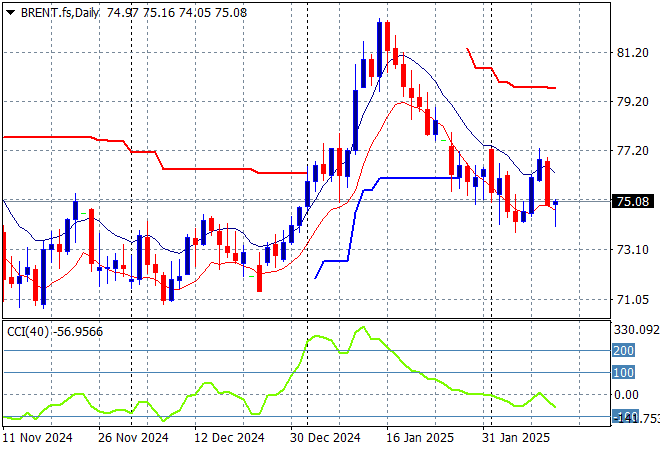
Oil markets are heating up again although both WTI and Brent crude were able to stabilise overnight, the latter almost just above the $75USD per barrel level after its recent sharp reversal.
The daily chart pattern shows the post New Year rally that got a little out of hand and now reverting back to the sideways action for the latter half of 2024. The potential for a new rally to form above the $77USD per barrel level from here is dwindling as recessionary fears mount:
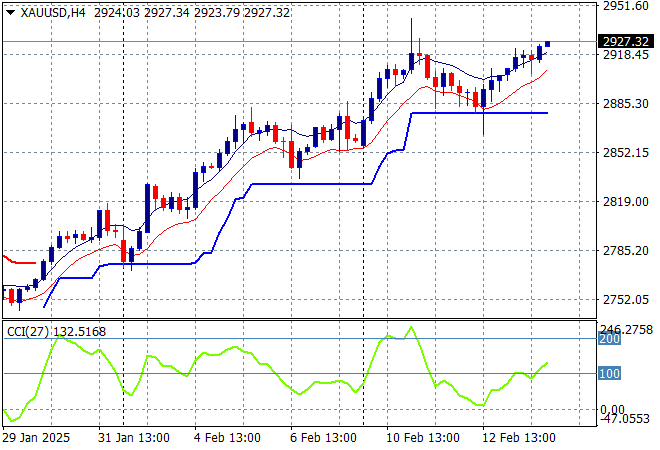
Gold wants to continue its surge above the $2900USD per ounce level despite being well overextended and had another move higher overnight to extend well above that level.
Price action had been accelerating in confidence in early December as new levels of support were being created regardless of USD strength but this pullback and rebound both had been fighting too much under the $2700 zone so I have been skeptical of any upside potential. However this is looking more interesting as the previous weekly high is now surpassed although momentum is quite overbought:
Glossary of Acronyms and Technical Analysis Terms:
ATR: Average True Range – measures the degree of price volatility averaged over a time period
ATR Support/Resistance: a ratcheting mechanism that follows price below/above a trend, that if breached shows above average volatility
CCI: Commodity Channel Index: a momentum reading that calculates current price away from the statistical mean or “typical” price to indicate overbought (far above the mean) or oversold (far below the mean)
Low/High Moving Average: rolling mean of prices in this case, the low and high for the day/hour which creates a band around the actual price movement
FOMC: Federal Open Market Committee, monthly meeting of Federal Reserve regarding monetary policy (setting interest rates)
DOE: US Department of Energy
Uncle Point: or stop loss point, a level at which you’ve clearly been wrong on your position, so cry uncle and get out/wrong on your position, so cry uncle and get out!