
Overnight saw the release of the latest FOMC minutes with Wall Street pushing up higher against the trend as European shares finally fell back after weeks of trending higher. The USD continues to make a comeback against the major undollars with Euro slipping although Yen is firming once more. Meanwhile the Australian dollar is holding on above the 63 cent level as future rate cut expectations by the RBA are being curtailed.
10 year Treasury yields are down to the 4.5% level again while trading in oil saw some minor gains with Brent crude lifting slightly above the $76USD per barrel level. Gold remains on an uptrend after snapping below the $2900USD per ounce level, pushing back to its previous record high at the $2930 level overnight.
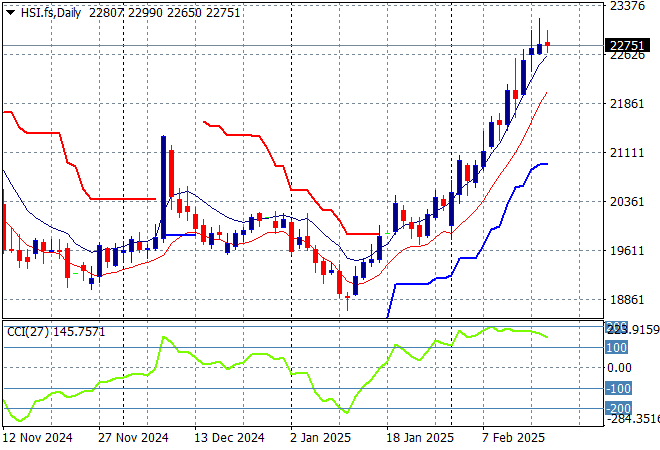
Looking at stock markets from Asia in yesterday’s session, where mainland Chinese share markets were able to push higher in afternoon trade with the Shanghai Composite up 0.8% to remain well above the 3300 point level while the Hang Seng Index has gone the other way to drift about 0.1% lower to 22858 points.
The Hang Seng Index daily chart shows how this recent move looks very unsustainable to the upside after recently setting up for another potential breakdown around the 20000 point level. Momentum is extremely overbought after beating the previous monthly highs at the 21500 level so I’d be very cautious here:
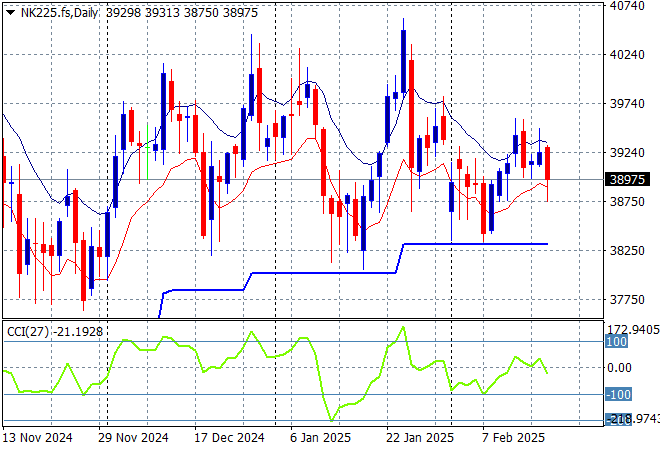
Japanese stock markets failed to bounce back on the slightly lower Yen with the Nikkei 225 closing 0.3% lower at 39168 points.
Price action had been indicating a rounding top on the daily chart with daily momentum retracing away from overbought readings with the breakout last month above the 40000 point level almost in full remission. Yen volatility remains a problem here, with a sustained return above the 38000 point level from May/June the support level that must be supported for another run higher:
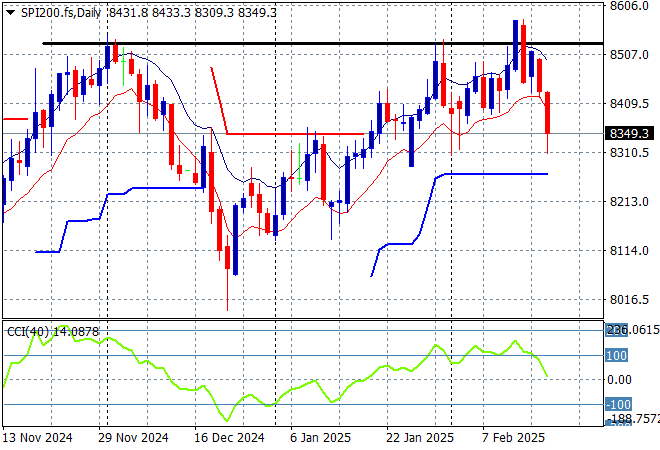
Australian stocks were still upset about the hawkish interest rate cut from the RBA with the ASX200 closing 0.7% lower at 8419 points.
SPI futures are looking to extend these falls today with 0.4% gap down at the open despite the good lead on Wall Street from overnight. The daily chart pattern and short price action suggests resistance overhead at the 8300 point level is starting to weigh on the market with a big push through required soon to get back to the 2024 highs:
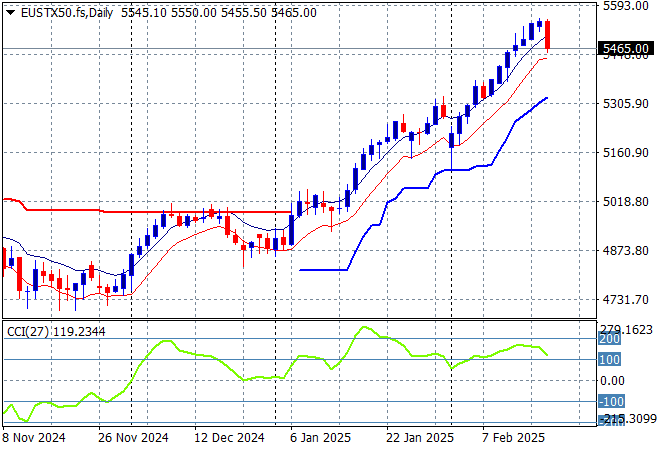
European markets slumped after doing very well in recent weeks with the Eurostoxx 50 Index falling over 1.3% to get back below the 5500 point level, closing at 5461 points.
This has the hallmarks of a rally that is running out of steam although daily momentum is overbought its not quite at extreme readings yet. Daily candlestick analysis shows some buying exhaustion setting in however, so watch for any inversion this week:
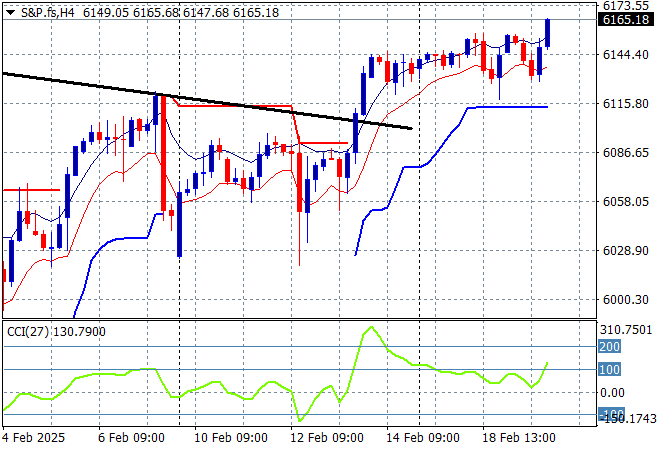
Wall Street continues to push forward but again it was a muted session with the NASDAQ gaining just 0.2% while the S&P500 was able to push through for a new record high, closing up 0.2% to 6114 points.
Price action had all the trademarks of a continuation below the 6000 point support level as the potential to overshoot and overreact to the FOMC meeting and following NFP print was building. This should have set up a rally into the 6200 point area but could the first stage of a pump and dump scheme although overhead resistance is weakening:
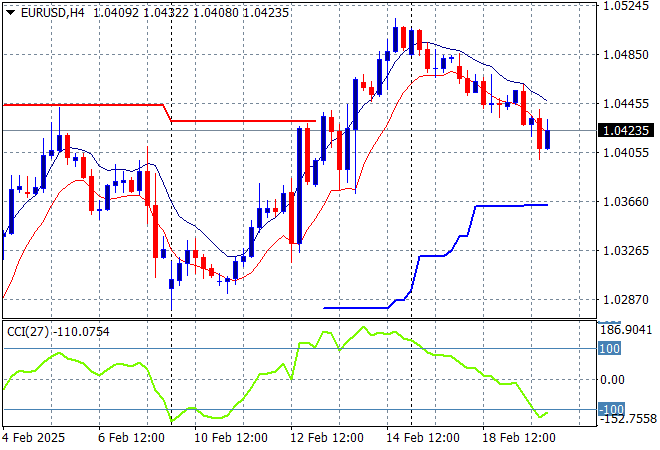
Currency markets are still somewhat anti-USD in their mood, although the FOMC minutes did provide more strength to the recent broader pullback with Euro in particular almost retracing to the 1.04 level overnight.
The union currency was looking weak at the start of last week but surged as the bluffs were called on Trump’s tariffs, with short and medium term support building after being under threat. Momentum is overextended and we could see some stabilisation through a move down to the mid or high 1.03 level here:
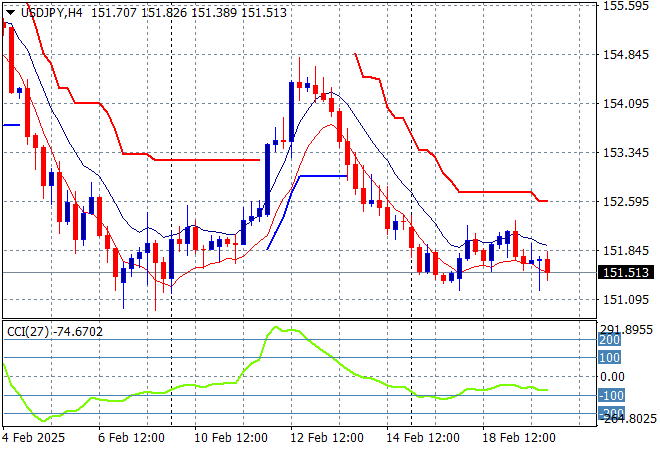
The USDJPY pair is trying to get out of its funk with Yen pulling it back to reality through deceleration into the early February lows around the 151 level with short term momentum struggling to get it off the ground.
Short term momentum was extremely oversold before the start of week bounce but requires price action to at least get over the 156 level to call this a proper trend higher for USD and this hasn’t come to pass as USD weakens structurally overall and domestic policies continue to strengthen Yen. Watch for a big strong break below the 151 level:
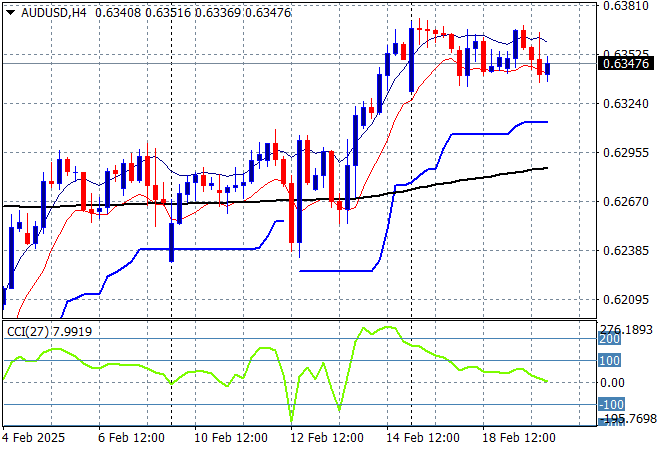
The Australian dollar remains surprisingly strong in the wake of continued tariff threats and USD weakness as it held fast above 63 handle following the recent cut at the RBA meeting.
The recent follow through to the high 62’s and low 63’s was always high risk going into the live February RBA rate meeting and after the Trumpian tariff crusade although this bounceback could shoot over the 200 day MA (moving black line) with a clear inverted head and shoulders pattern – but wait and see!
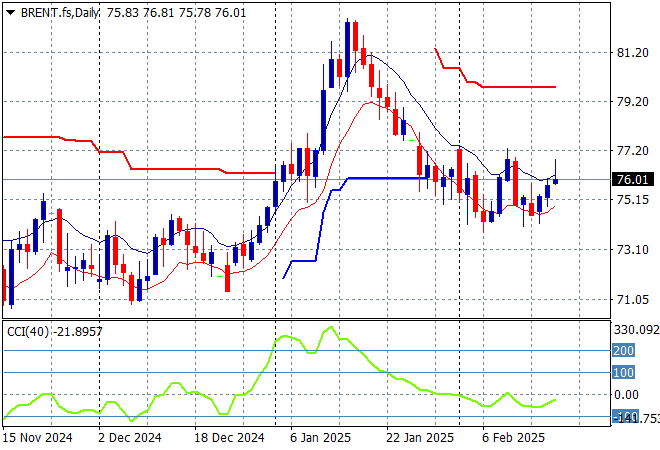
Oil markets are cooling down with Brent crude pushing slightly above its previous daily lows at the $76USD per barrel level after its recent sharp reversal but still looking weak internally on the short run.
The daily chart pattern shows the post New Year rally that got a little out of hand and now reverting back to the sideways action for the latter half of 2024. The potential for a new rally to form above the $77USD per barrel level from here is dwindling as recessionary fears mount:
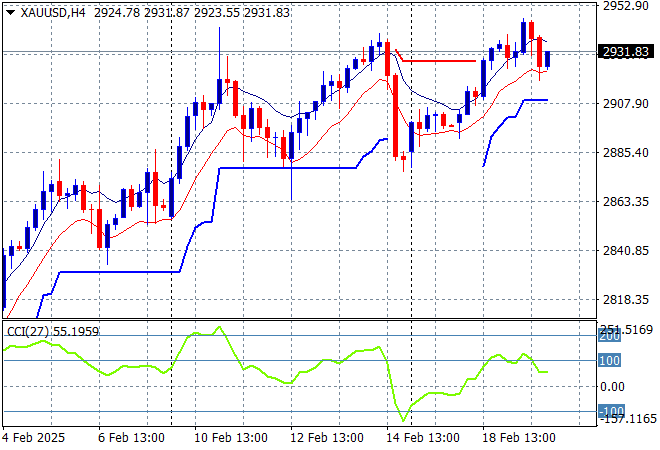
Gold wants to continue its surge above the $2900USD per ounce level after suffering a sharp retracement from being overextended through the latter half of last week with a significant bounce in the previous session now setting up for a run at the $3000 level.
Price action had been accelerating in confidence in early December as new levels of support were being created regardless of USD strength but this pullback and rebound both had been fighting too much under the $2700 zone so I have been skeptical of any upside potential. However this is looking more interesting as the previous weekly high is now surpassed although momentum is quite overbought:
Glossary of Acronyms and Technical Analysis Terms:
ATR: Average True Range – measures the degree of price volatility averaged over a time period
ATR Support/Resistance: a ratcheting mechanism that follows price below/above a trend, that if breached shows above average volatility
CCI: Commodity Channel Index: a momentum reading that calculates current price away from the statistical mean or “typical” price to indicate overbought (far above the mean) or oversold (far below the mean)
Low/High Moving Average: rolling mean of prices in this case, the low and high for the day/hour which creates a band around the actual price movement
FOMC: Federal Open Market Committee, monthly meeting of Federal Reserve regarding monetary policy (setting interest rates)
DOE: US Department of Energy
Uncle Point: or stop loss point, a level at which you’ve clearly been wrong on your position, so cry uncle and get out/wrong on your position, so cry uncle and get out!