
Wall Street continues to flail while European stocks try hard to push forward, buoyed by more defense spending promises while the cuts in US federal spending and employment loom large amid a the Canadian/Mexican tariffs that are still on the table. The USD was pushed back by Euro and Yen again overnight while the Australian dollar remains well below the 64 cent level.
10 year Treasury yields fell nearly 10 points to its lowest level since December 2024, down below the 4.3% level while oil prices fell nearly 3% on recession fears with Brent crude now below the $73USD per barrel level. Gold suffered a setback as well retracing below the $2900USD per ounce level.
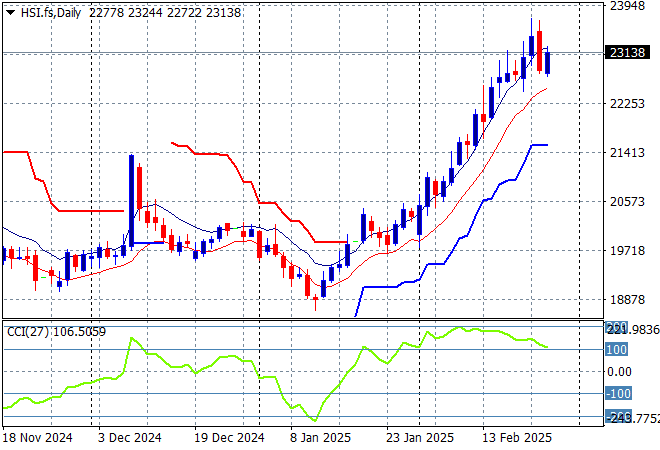
Looking at stock markets from Asia in yesterday’s session, where mainland Chinese share markets were down in afternoon trade with the Shanghai Composite around the 3350 point level while the Hang Seng Index has also retraced heavily to be down 1.3% to hold just above the 23000 point level.
The Hang Seng Index daily chart shows how this recent move looks very unsustainable to the upside after recently setting up for another potential breakdown around the 20000 point level. Momentum is extremely overbought after beating the previous monthly highs at the 21500 level so I’d be very cautious here:
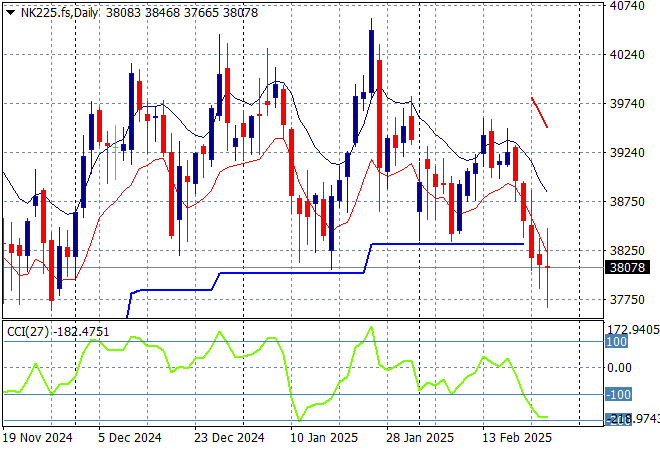
Japanese stock markets have returned from their long weekend holiday with Nikkei 225 losing more than 1.3% in a sharp down session, closing at 38237 points.
Price action had been indicating a rounding top on the daily chart with daily momentum retracing away from overbought readings with the breakout last month above the 40000 point level almost in full remission. Yen volatility remains a problem here, with a sustained return above the 38000 point level from May/June the support level unlikely:
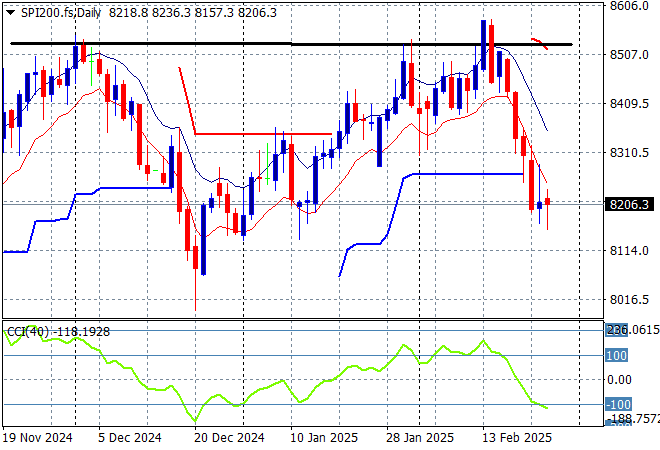
Australian stocks are still failing to put on some runs with the ASX200 closing 0.6% lower at 8256 points.
SPI futures are down at least 0.3% due to the continued pullbacks on Wall Street overnight. The daily chart pattern and short price action suggests resistance overhead at the 8500 point level is far to heavy for the market to overcome with short term momentum nearly oversold and ready to go lower:
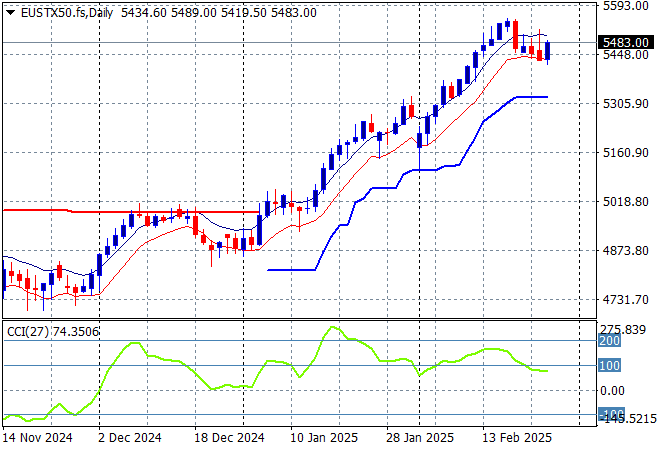
European markets had mixed sessions losses across the continent as the Eurostoxx 50 Index closed 0.1% lower at 5447 points.
This has the hallmarks of a rally that is running out of steam although daily momentum was overbought it never got to extreme readings. Daily candlestick analysis shows some buying exhaustion setting in however, so watch for any inversion this week with the harbinger a close below the low moving average (red line):
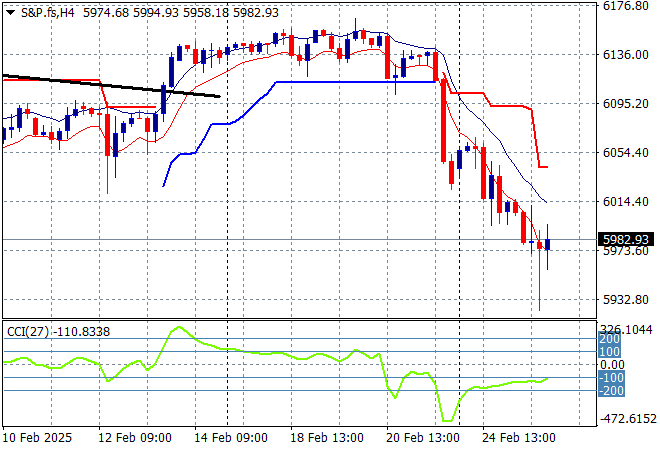
Wall Street remains in the doldrums, continuing the week in poor fashion as the NASDAQ fell more than 1.3% while the S&P500 lost nearly 0.4% to close at 5961 points.
This should have set up a rally into the 6200 point area but the good old Trump pump and dump scheme is working a treat here as overhead resistance rejected further calls to launch higher. As I said on Friday, watching ATR support at the 6100 point level proper for an inversion as the selloff was beckoning:
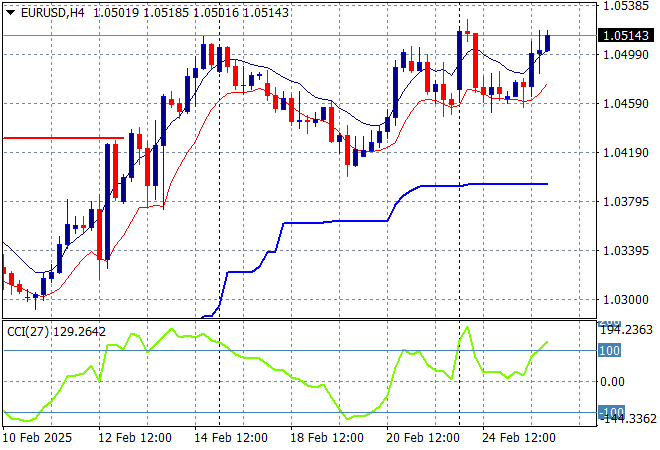
Currency markets are coming back against King Dollar as domestic recession fears loom with a resurging Euro taking out the 1.05 handle overnight to match its recent highs.
The union currency was looking weak at the start of last week but surged as the bluffs were called on Trump’s tariffs, with short and medium term support building after being under threat. Momentum was overextended with support clear at the 1.04 level before this move higher:
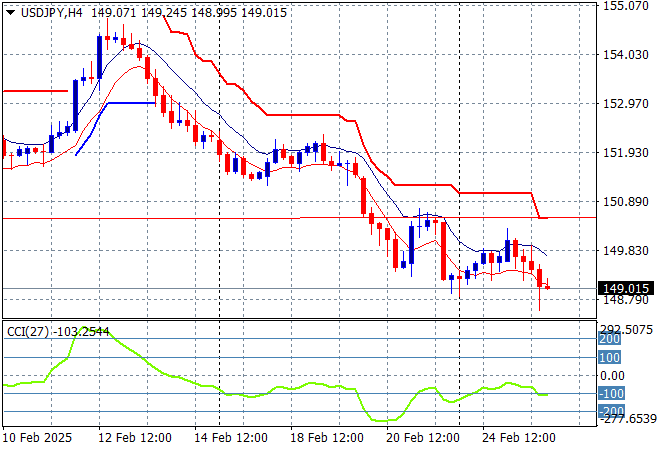
The USDJPY pair is still failing to get out of its funk after a very brief deceleration phase into the early February lows around the 151 level with short term momentum pushing it further down to the 149 level overnight.
Short term momentum was extremely oversold before the start of week bounce but required price action to at least get over the 156 level to call this a proper trend higher. As USD weakens structurally overall and domestic policies continue to strengthen Yen I’ve been warning for sometime about a strong break below the 151 level:
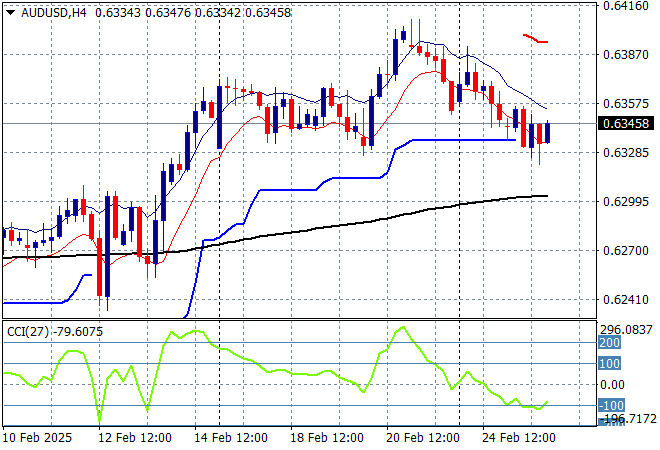
The Australian dollar was surprisingly strong in the wake of continued tariff threats and USD weakness but this breakout above the 64 cent level has been short lived with a retracement back to the mid 63 level overnight due to a rally in USD.
The recent follow through to the high 62’s and low 63’s was always high risk going into the live February RBA rate meeting and after the Trumpian tariff crusade although this bounceback could shoot over the 200 day MA (moving black line) with a clear inverted head and shoulders pattern – but wait and see!
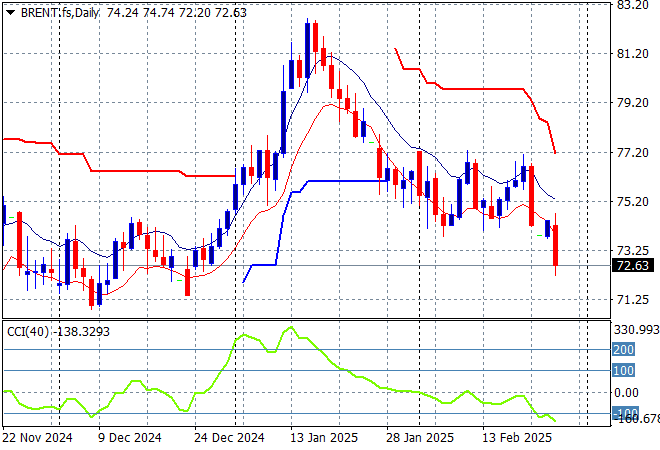
Oil markets are failing to get back on track with another downside move overnight with Brent crude pushed back below the $73USD per barrel level as it still looks weak internally on the short run as resistance proved too hard to overcome overhead.
The daily chart pattern shows the post New Year rally that got a little out of hand and now reverting back to the sideways action for the latter half of 2024. The potential for a return to the 2024 lows is building here:
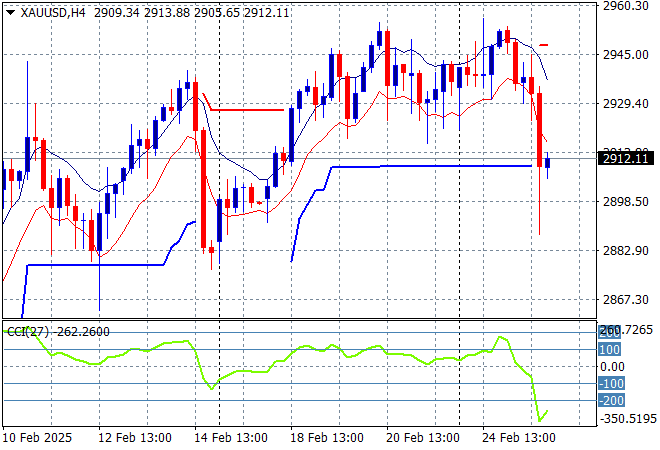
Gold is failing to continue its surge above the $2900USD per ounce level with a sharp retracement overnight that briefly saw it go under that level before a late reprieve with a close just above $2910USD per ounce this morning.
Price action is finding a lot of resistance just under the $2960 zone and this continued overnight with a swing down to ATR support on the four hourly chart that then turned into a selloff. Watch for the $2900 level to become a point of control for the remainder of the trading week:
Glossary of Acronyms and Technical Analysis Terms:
ATR: Average True Range – measures the degree of price volatility averaged over a time period
ATR Support/Resistance: a ratcheting mechanism that follows price below/above a trend, that if breached shows above average volatility
CCI: Commodity Channel Index: a momentum reading that calculates current price away from the statistical mean or “typical” price to indicate overbought (far above the mean) or oversold (far below the mean)
Low/High Moving Average: rolling mean of prices in this case, the low and high for the day/hour which creates a band around the actual price movement
FOMC: Federal Open Market Committee, monthly meeting of Federal Reserve regarding monetary policy (setting interest rates)
DOE: US Department of Energy
Uncle Point: or stop loss point, a level at which you’ve clearly been wrong on your position, so cry uncle and get out/wrong on your position, so cry uncle and get out!