In January, Domain published the following chart showing how the percentage of income Australians spent to service mortgage repayments on a median-priced home had hit a record high of 50.6% at the end of 2024.
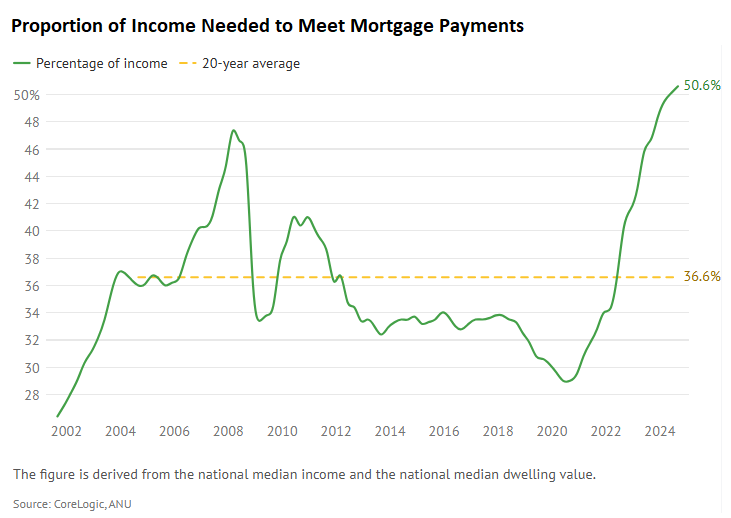
This was up from the decade average of 36.6%.
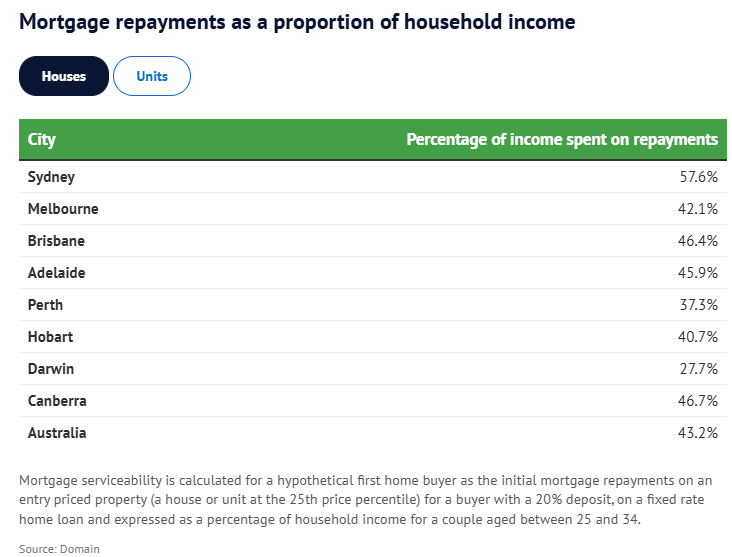
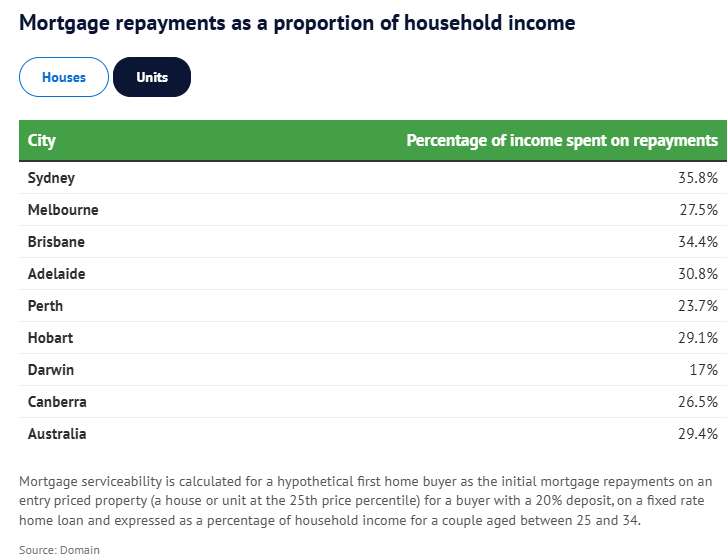
New data from Domain shows the breakdown of mortgage payments across each capital city.
The data represents the initial repayments for a hypothetical first home buyer with a 20% deposit on a fixed-rate home loan and is expressed as a percentage of household income for a couple aged between 25 and 34.
The modeling assumes both household members earn the city’s average income for 25- to 34-year-olds.
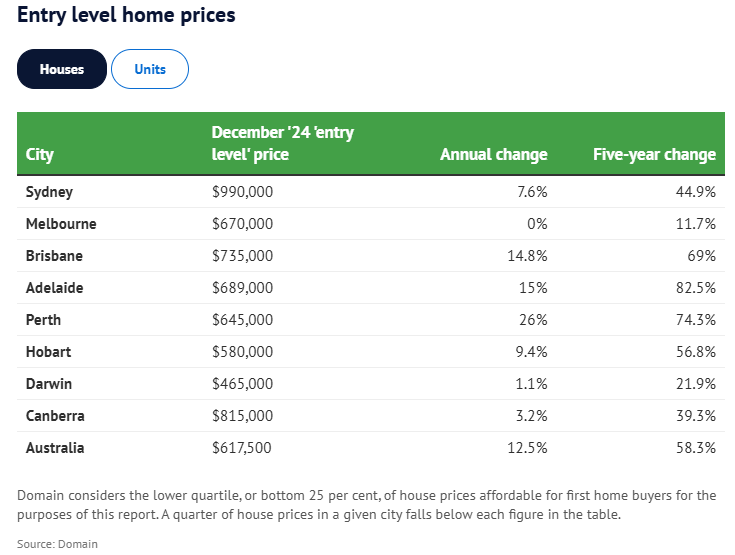
Domain defines an entry-level house as the bottom quartile of the market, priced at $990,000 or less in Sydney and $670,000 or less in Melbourne. In practice, buyers would need to move to a far-flung location to find a house at this price.
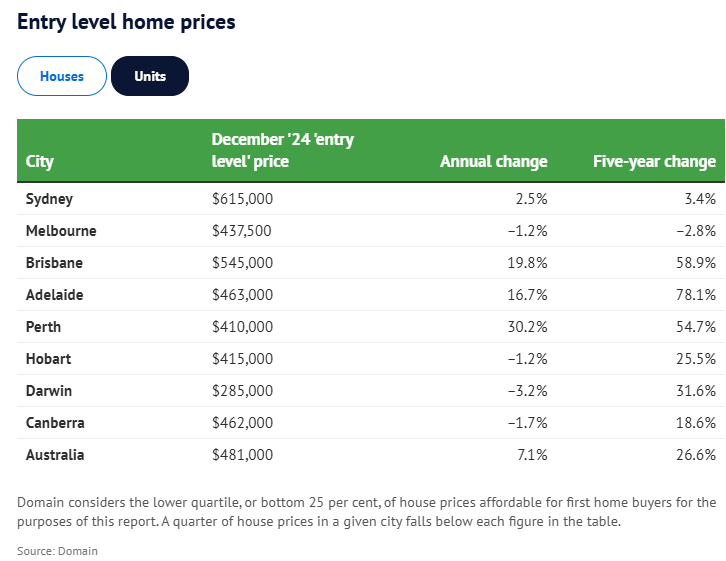
Domain defines an entry-level unit as the bottom quartile of the market, priced at $615,000 or less in Sydney and $437,500 or less in Melbourne. Such units are likely to be cramped.
The Australian Bureau of Statistics (ABS) considers households to be in housing stress if they spend more than 30% of their income on housing.
Domain’s modelling shows that first home buyers across every house market except Darwin would experience mortgage stress, based on the ABS’ definition.
According to the ABS ‘ definition, the news is better for first-time unit buyers, with only Sydney, Brisbane, and Adelaide buyers experiencing stress.
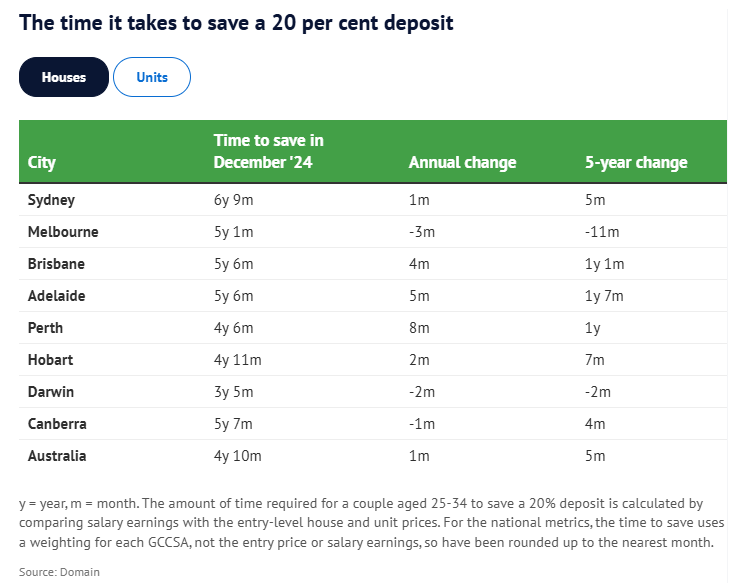
It is important to note that Domain assumes that buyers have a 20% deposit, which has become increasingly difficult to achieve.
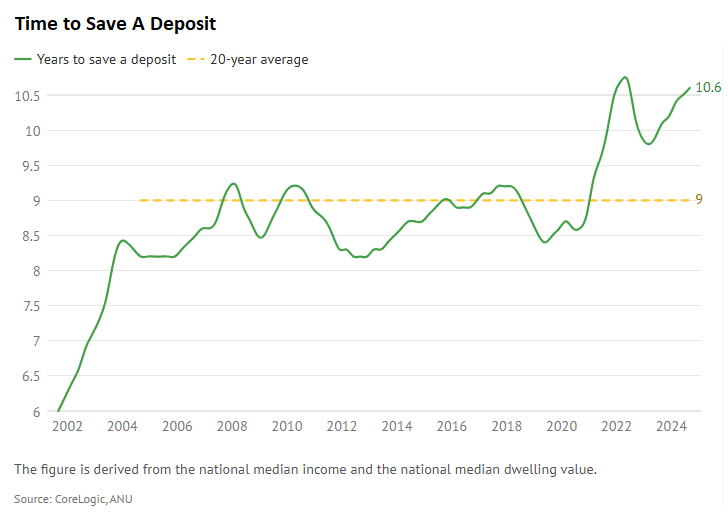
At the national median level, it took an average of 10.6 years to save a deposit at the end of 2024, above the decade average of nine years.
For first-home buyers purchasing an entry-level house at the bottom quartile of the market, it would take 4 years and 10 months to save a 20% deposit and 6 years and 9 months in Sydney.
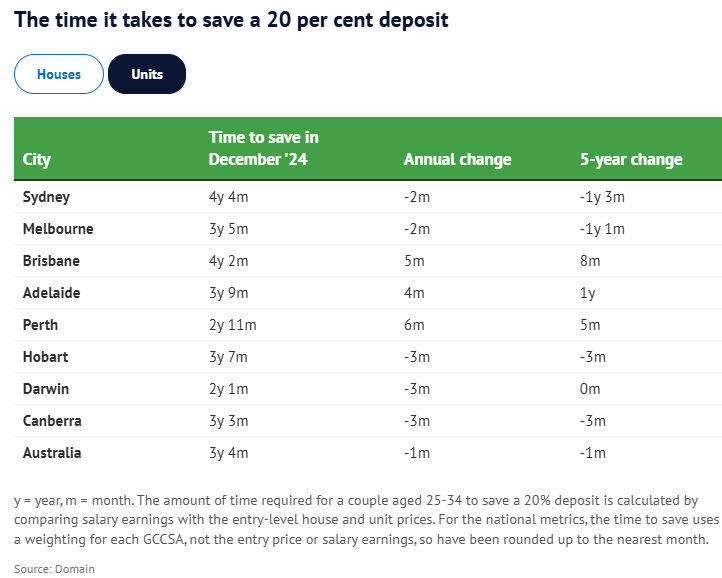
For unit buyers, purchasing an entry-level unit at the bottom quartile of the market would take an average of 3 years and 4 months nationally and 4 years and 4 months in Sydney.
It is worth mentioning that Domain has assumed a two-person household where both partners work and earn the city’s average income for 25- to 34-year-olds.
This means the affordability is far worse for a single-income person or household.
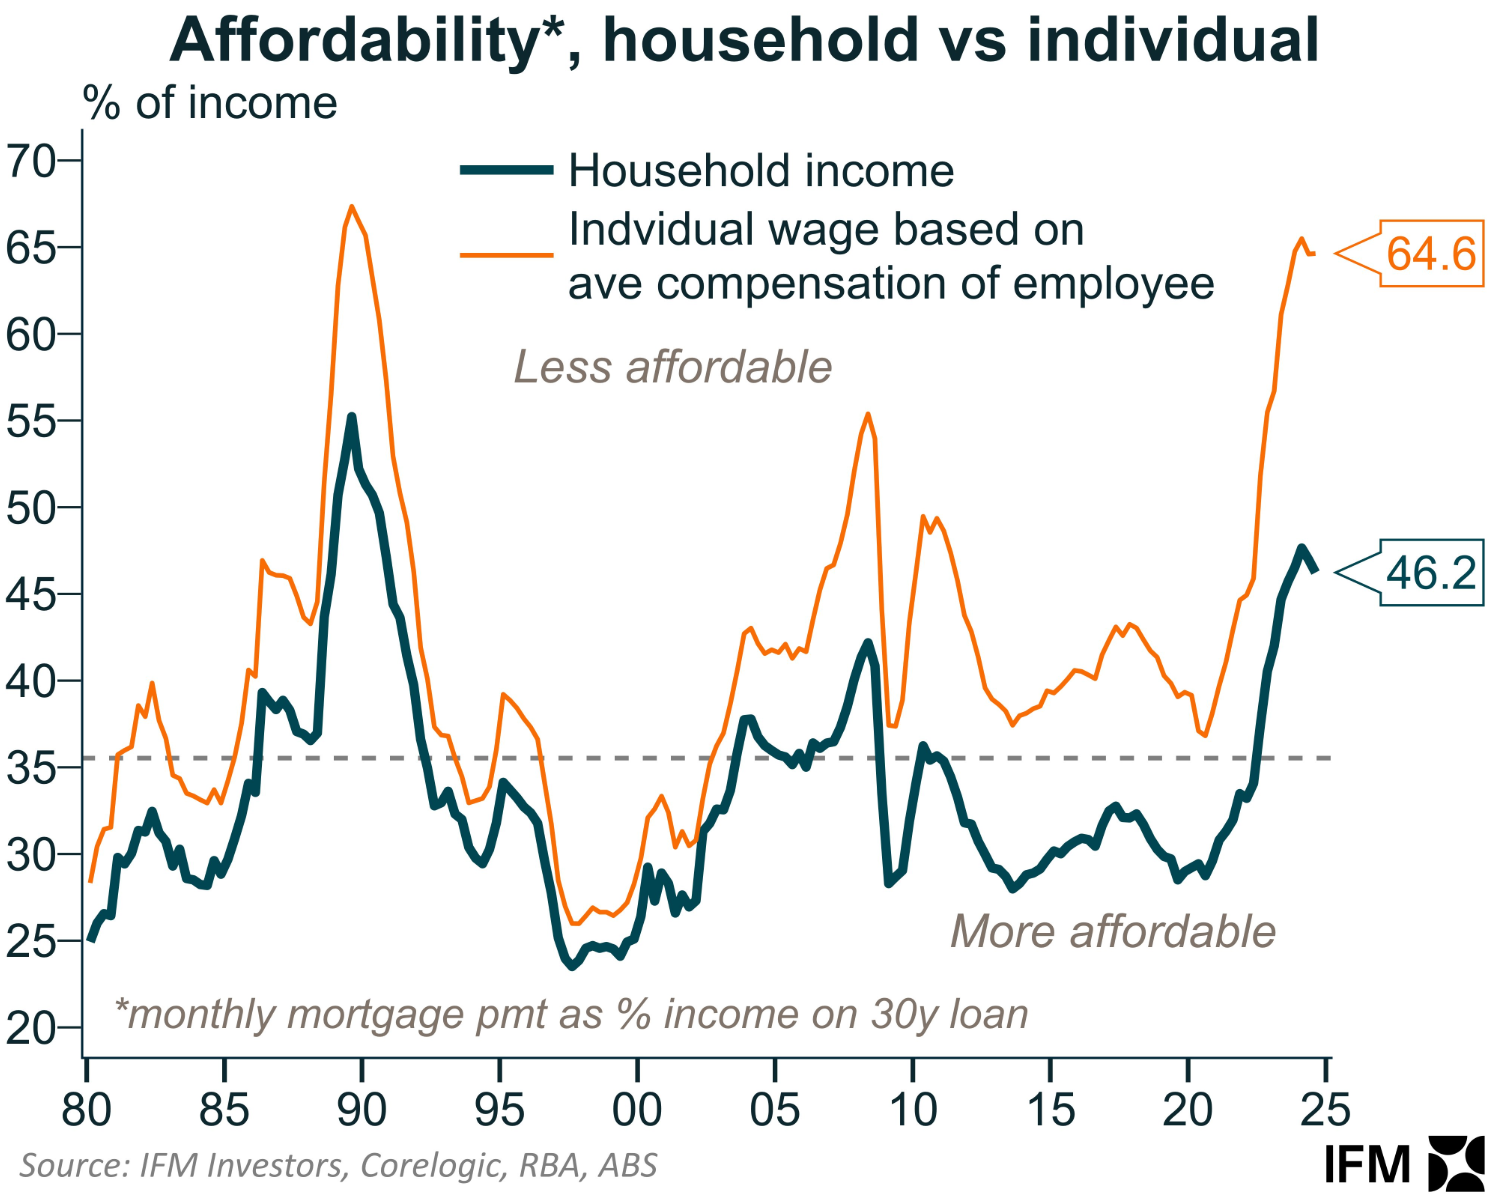
As shown below by Alex Joiner from IFM Investors, recent ‘affordability’ has been as bad as what was experienced in the 1980s and 90s once the income definition is held constant.
The bottom line is that Australians today are paying far more to live in a far-flung house on a postage-stamp-sized lot on the fringe. Or in a high-rise shoebox.
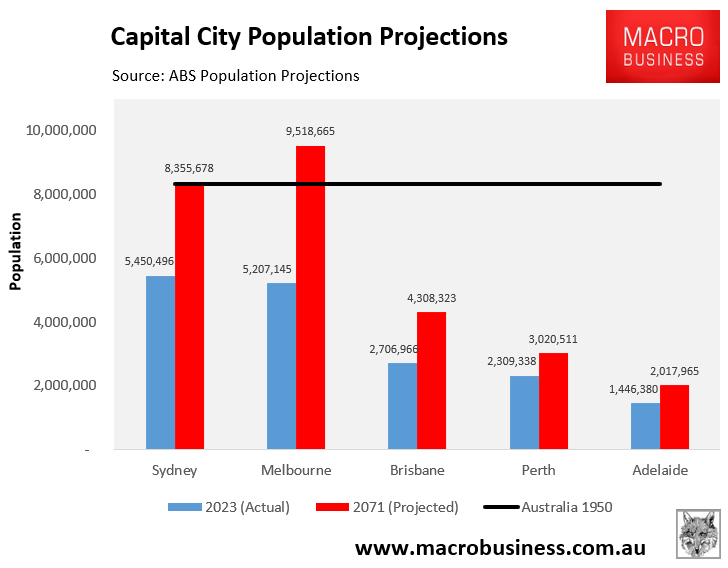
The situation will worsen as our cities continue to balloon in size courtesy of endless mass immigration.
How does this represent economic progress?