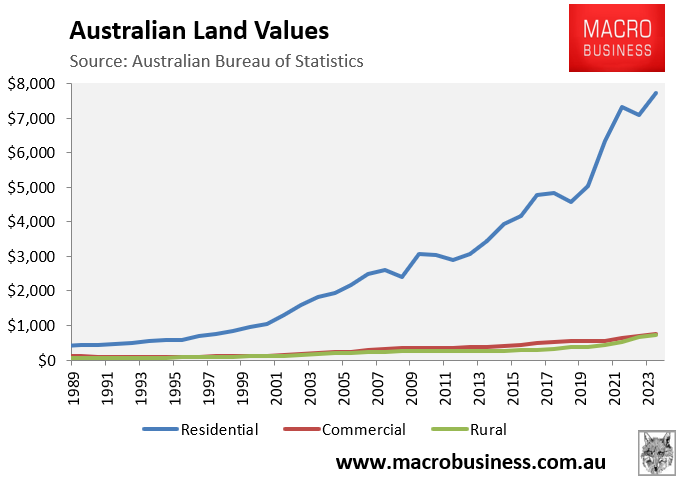
The Australian Bureau of Statistics’ (ABS) latest annual national accounts reported that Australia’s land was valued at $9.2 trillion in 2023-24, with residential land accounting for 84% ($7.7 trillion).
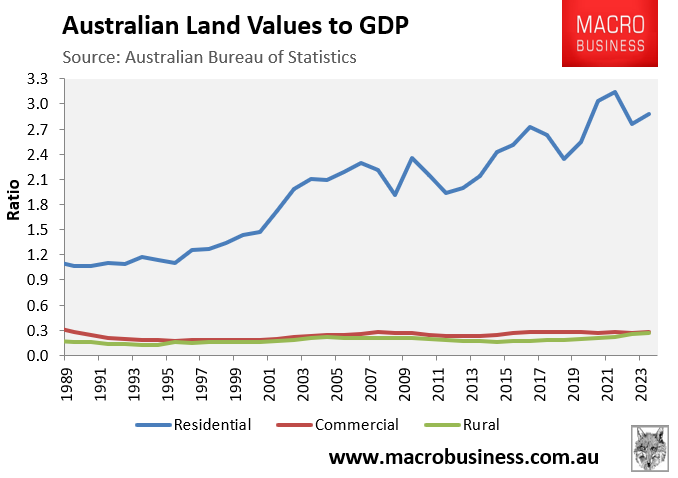
As illustrated below, residential land values have skyrocketed from 1.1 times Australia’s GDP in 1989 to 2.9 times GDP as of 2023-24.
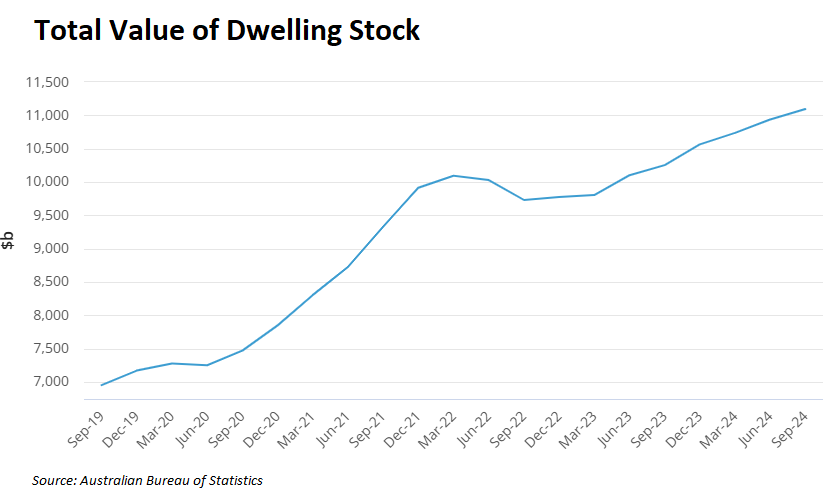
The total value of Australia’s dwelling stock (i.e., land and buildings) was valued at $11.1 trillion as of 31 December 2024.
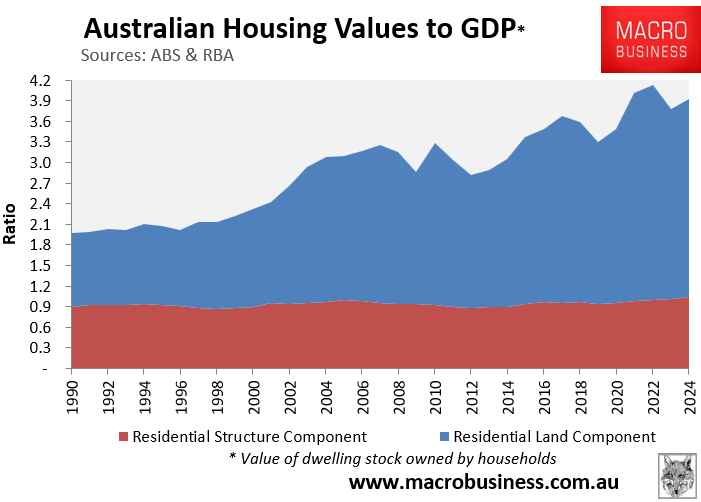
The value of Australia’s dwelling stock has grown from 2.0 times GDP in 1988-89 to 3.9 times GDP in 2023-24, driven by the strong inflation in land values.
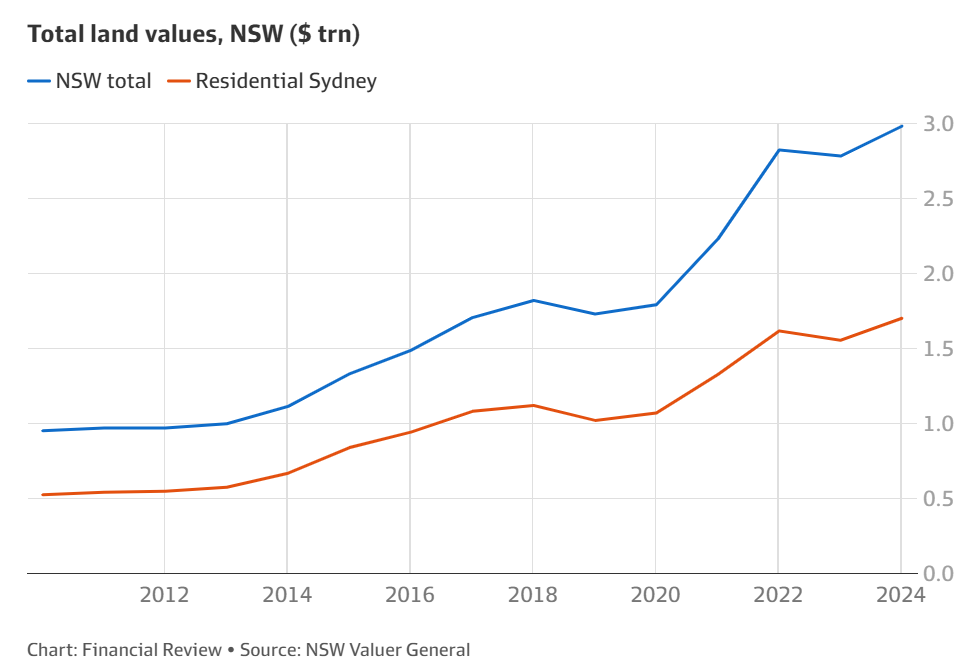
NSW Valuer-General Sally Dale assessed that the state’s land values reached $2.98 trillion in 2023-24, up 6.4% on the year before.
When an additional 8,919 parcels of land were registered as a result of subdivisions and new properties created, it saw NSW land values rise above $3 trillion.
Dale says that the increase in values is probably “not healthy” as it puts pressure on home buyers, particularly those buying their first one.
“What has happened in the last few years is things have gone up significantly and that has put a lot of pressure on, especially, first home buyers and homebuyers in general”, she said.
“What we’ve seen probably is not healthy, and obviously that’s driven by supply and demand and a lot of other factors as well”.
Increases in land values can result in land tax surprises for property owners, while she says it will take a few more interest rate cuts before the property market moves out of negative territory.
The ABS includes a time series measuring the value of the housing stock broken down by state and territory.
The following chart compares these values as at Q2 2024 against their respective GSPs/GDP.
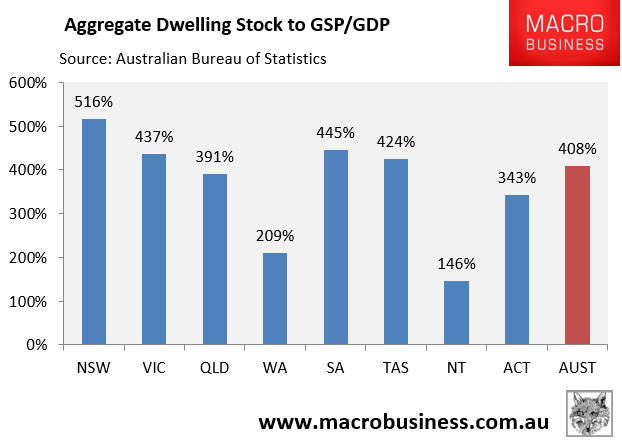
NSW leads the way (516%), followed by SA (445%), VIC (437%), and TAS (424%).
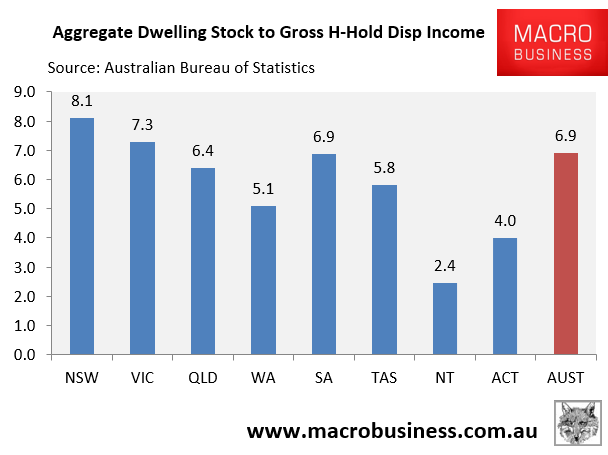
NSW also has the most expensive housing stock when measured against household disposable income.
The rising cost of land in Australia is one of the major impediments to developing new dwellings for the rapidly expanding population.
In economic terms, this land cost-push inflation has shifted the aggregate supply curve to the left, reducing the capacity for building homes at every price tier:
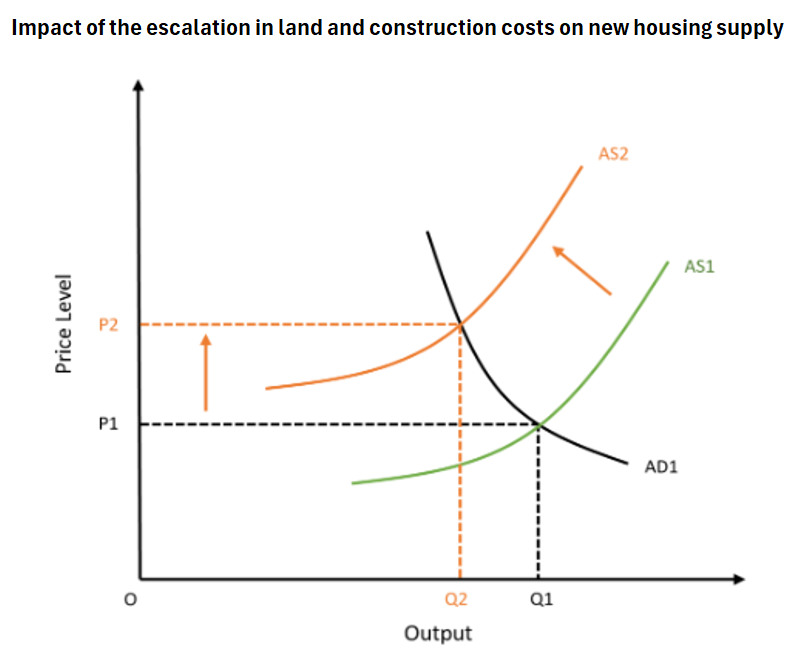
The impact on NSW’s housing construction is illustrated below:
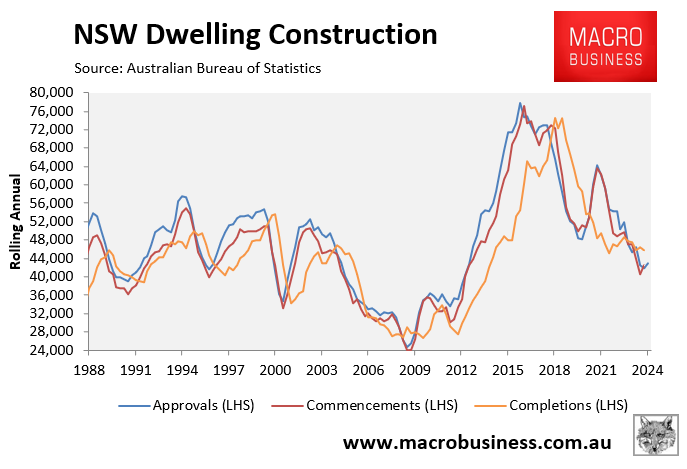
Expensive land prices are a key barrier to housing construction and affordability.
