The Australian Bureau of Statistics (ABS) released its Q4 national accounts last week, which was a disaster for households.
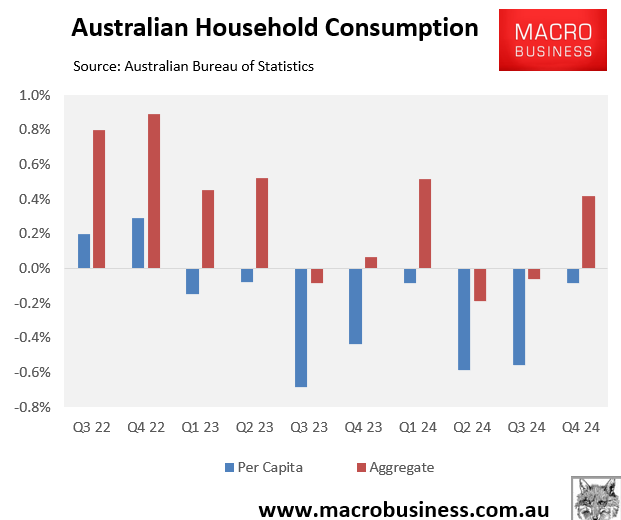
While the overall economy finally exited the 21-month per capita recession, real per capita household consumption declined for a record eighth consecutive quarter.
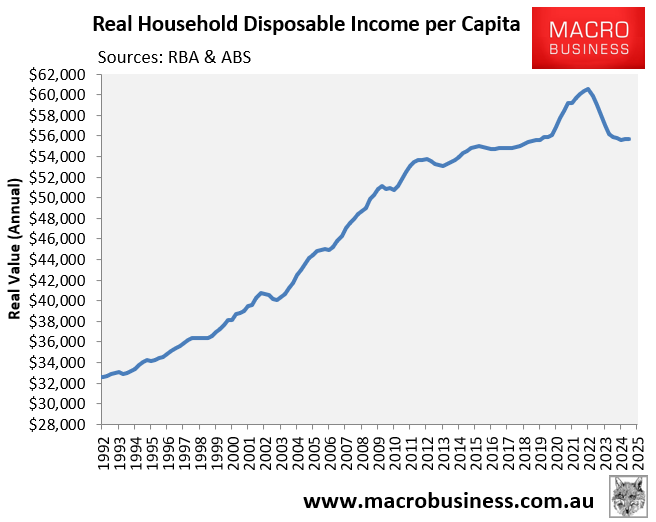
The income side of the ledger was even worse.
Annual real per capita household disposable income declined for a record tenth consecutive quarter, down 8.1% from the June 2022 peak.
The next chart plots the current decline in annual real per capita household disposable income against prior downturns.
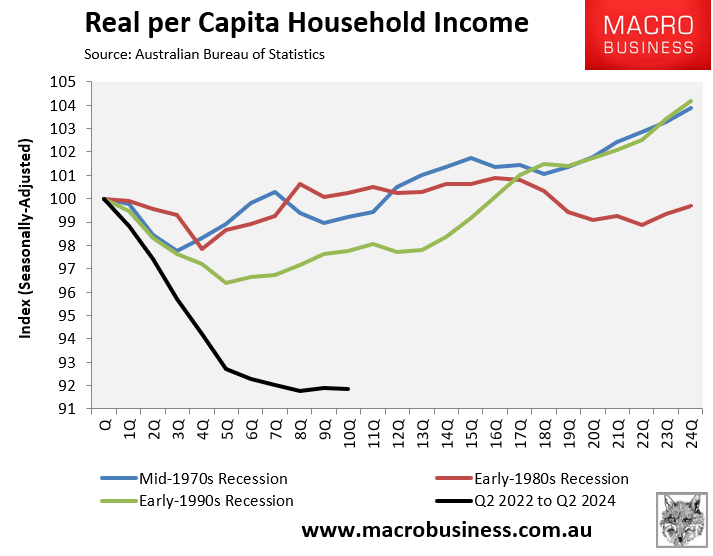
The current decline of 8.1% over 10 quarters dwarfs the 3.6% peak-to-trough decline recorded during the early 1990s recession.
The next chart plots the decade average growth in real per capita household disposable income back to 1959.
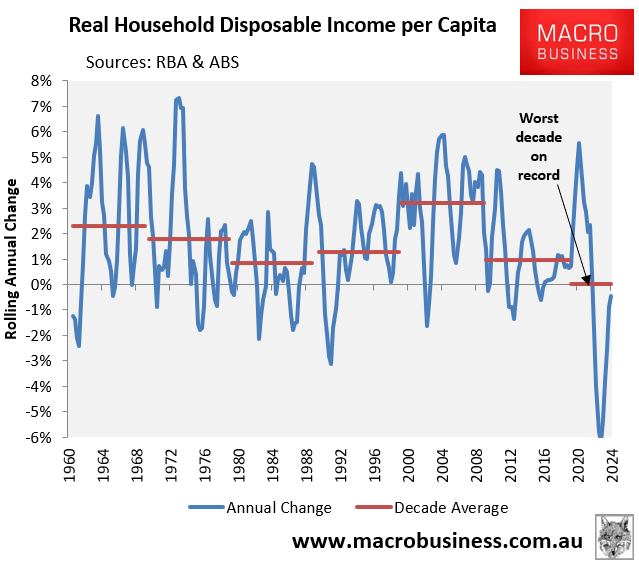
The 0.04% average annual growth so far this decade is the worst in 75 years of data.
By comparison, real per household disposable income grew by 0.95% per annum in the 2010s, 3.10% in the 2000s, 1.26% in the 1990s, 0.83% in the 1980s, 1.80% in the 1970s, and 2.29% in the 1960s.
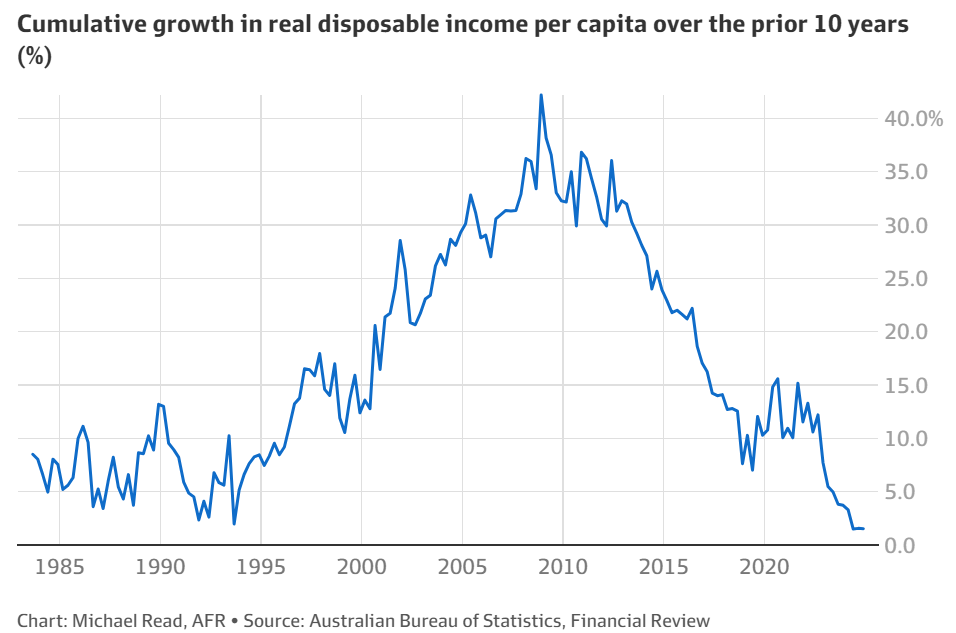
The AFR’s Michael Read published a similar chart last week showing that on a 10-year rolling basis, growth in real disposable income per capita (1.4%) was the slowest since records began.
Given the collapse in Australia’s productivity and the expected decline in Australia’s terms-of-trade, it is difficult to see how real household incomes will return to healthy growth.
