
It’s risk off across stock markets as Trump goes all Lord Farquaad aka Paul Keating admitting a US recession is all but coming due to his tariffs taunts with Wall Street falling more than 2% across the board with the NASDAQ falling 4% in one session! So much winning! European stocks are feeling the heat too with a sustained pullback with Asian stocks likely to feel the correlated brunt on the open this morning. The flailing USD is just holding against the major undollars although Yen is outperforming again while the Australian dollar has retraced back below the 63 cent level.
10 year Treasury yields dropped again, back down to the 4.2% level while oil prices gave back their recent gains as US recession fears mount with Brent crude dropping below the $69USD per barrel level. Gold also remained aligned with risk assets and fell back below the $2900USD per ounce level.
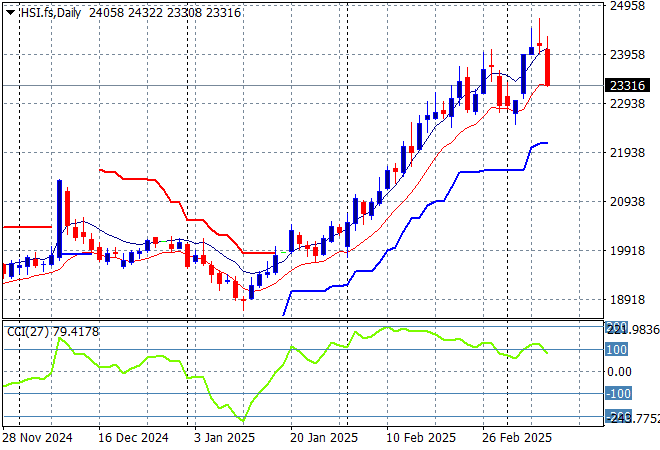
Looking at stock markets from Asia from yesterday’s session, where mainland Chinese share markets moved a little lower in afternoon trade with the Shanghai Composite down around 0.2% to 3366 points while the Hang Seng Index lost over 1.8% to below the 24000 point level again.
The Hang Seng Index daily chart shows how this recent move looked unsustainable to the upside after recently setting up for another potential breakdown around the 20000 point level but has brushed this caution aside. Momentum remains overbought after beating the previous monthly highs at the 21500 level but as I warned last week – be cautious here in the face of another reversal:
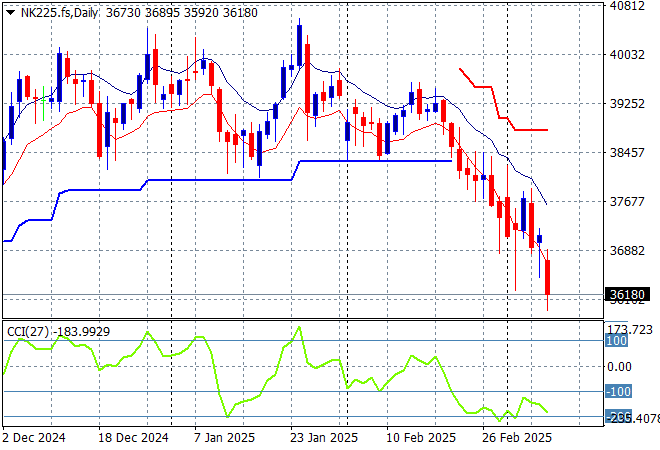
Japanese stock markets however are quite mixed on the resurgent Yen with the Nikkei 225 up nearly 0.4% to close at 37028 points.
Price action had been indicating a rounding top on the daily chart for sometime now with daily momentum retracing away from overbought readings with the breakout last month above the 40000 point level now in full remission. Yen volatility remains a problem here, with a sustained return above the 38000 point level unlikely with futures indicating another selloff as the trading week continues to new lows:
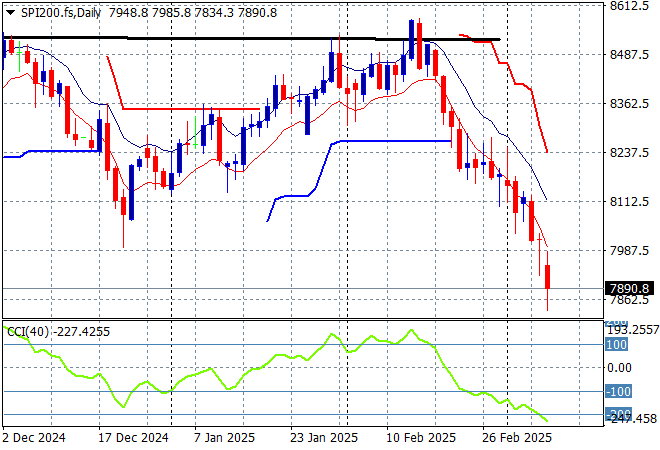
Australian stocks finally had an up day but it was marginal at best as the ASX200 closed just 0.2% higher at 7962 points.
Although SPI futures are now down at least 0.9% due to the bath of blood on Wall Street from overnight. The daily chart pattern suggests resistance overhead at the 8500 point level is far too heavy for the market to overcome with short term momentum oversold and ready to go lower:
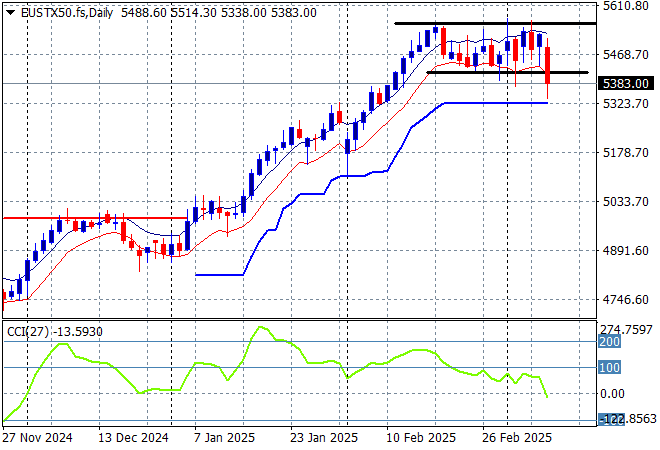
European markets had uneasy sessions across the continent, finally succumbing to selling as the Eurostoxx 50 Index finished some 1.4% lower at 5386 points.
This no longer looks like a rally that is running out of steam as daily momentum reverts back from overbought to positive readings in a steady consolidation. Daily candlestick analysis showed some buying exhaustion setting but optimism might be coming to the fore again so watch for a breakout above the 5500 point region:
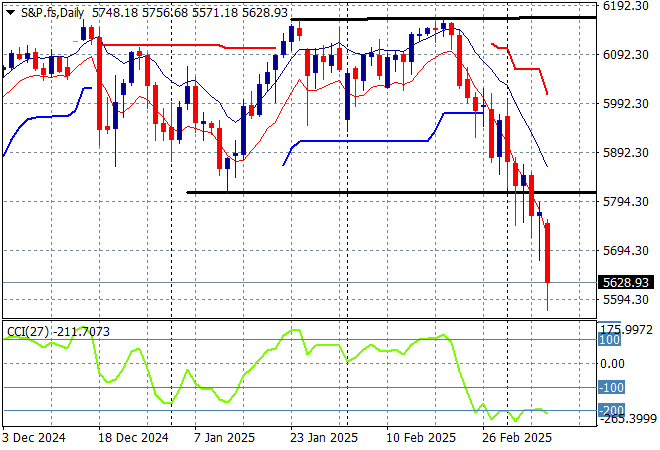
Wall Street saw some bottom picking on the NFP print but this has been very short lived as the NASDAQ dived exactly 4% while the S&P500 lost more than 2% to finish at 5614 points.
The Trump pump and dump scheme is working a treat here as overhead resistance rejected further calls to launch higher above that 6000 points throughout Jan and Feb with momentum now taking the market back to the September 2024 lows and possibly lower:
Currency markets remain strongly against King Dollar on the burgeoning trade wars with tomorrow night’s US CPI print a key focus this week as Euro again held fast just above the 1.08 handle to hold on to its new monthly high.
The union currency surged as the bluffs were called on Trump’s tariffs, with short and medium term support building at higher levels. Momentum was overextended earlier in the week and has now reverted so watch for a potential pullback on newsflow:

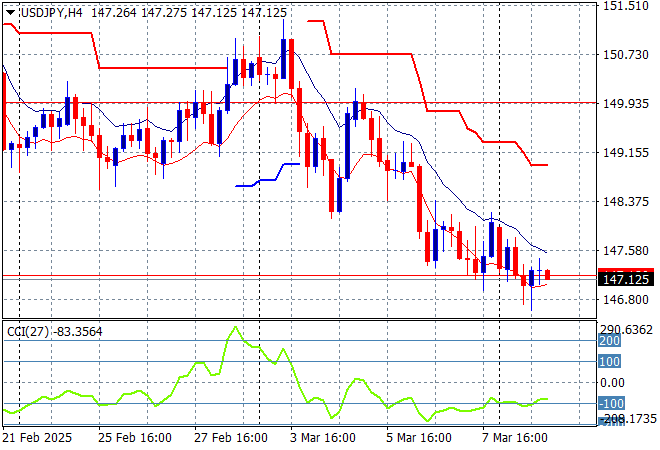
The USDJPY pair is still failing to get out of its funk after a very brief deceleration phase into the early February lows around the 151 level although short term momentum is fighting back with a slight push above the 147 level overnight that seems short lived:
Short term momentum was extremely oversold before the start of week bounce but required price action to at least get over the 156 level to call this a proper trend higher. As USD weakens structurally overall and domestic policies continue to strengthen Yen I’ve been warning for sometime about a strong break below the 151 level:
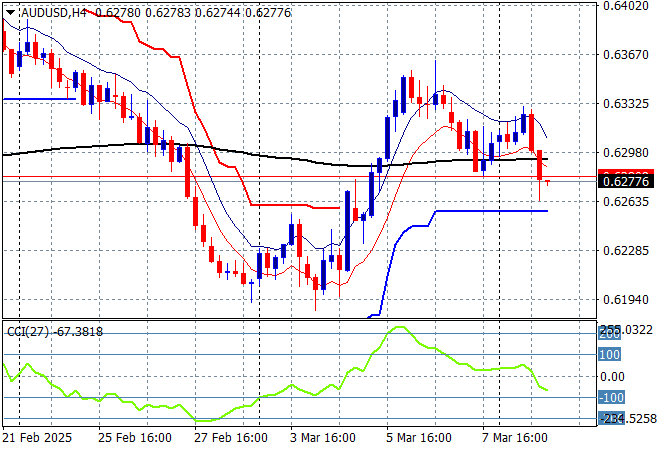
The Australian dollar is failing to get back into the swing of things with some recent upper movement around the 63 cent level but the risk off mood is now taking a toll with a retracement below that level overnight.
The recent follow through to the high 62’s and low 63’s was always high risk going into the live February RBA rate meeting and after the Trumpian tariff crusade although this bounceback could of shot over the 200 day MA (moving black line) with a clear inverted head and shoulders pattern – but did not come to pass. This is setting up for another look see at the 60 cent level:
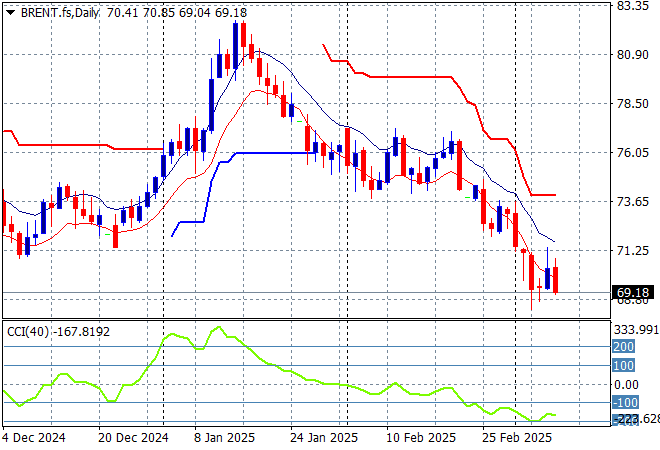
Oil markets are failing to get back on track with Brent crude pushed further down all last week before a late reprieve saw it steady at the $70USD per barrel level but remains weak internally as it cracked below the $69 level overnight on US recession admissions.
The daily chart pattern shows the post New Year rally that got a little out of hand and now reverting back to the sideways lower action for the latter half of 2024. The potential for a return to the 2024 lows is building here:
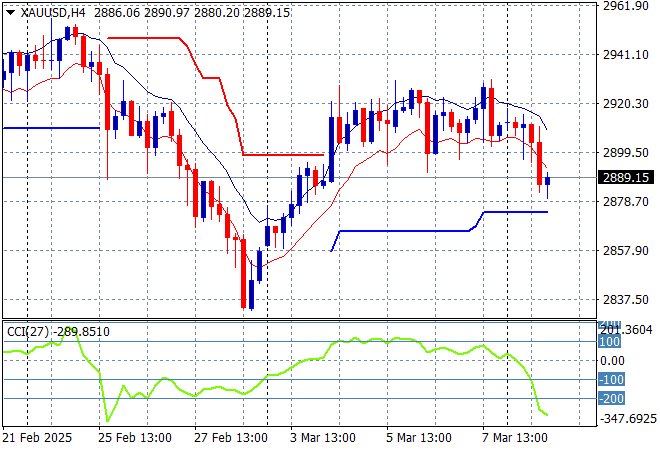
Gold has managed to get back above the $2900USD per ounce level last week but like the Aussie has correlated with other risk assets here with a steady selloff overnight sending it back below that level this morning.
Price action has always found a lot of resistance just under the $2960 zone so that is the likely target in any upside potential but for now momentum is strongly against the shiny metal:
Glossary of Acronyms and Technical Analysis Terms:
ATR: Average True Range – measures the degree of price volatility averaged over a time period
ATR Support/Resistance: a ratcheting mechanism that follows price below/above a trend, that if breached shows above average volatility
CCI: Commodity Channel Index: a momentum reading that calculates current price away from the statistical mean or “typical” price to indicate overbought (far above the mean) or oversold (far below the mean)
Low/High Moving Average: rolling mean of prices in this case, the low and high for the day/hour which creates a band around the actual price movement
FOMC: Federal Open Market Committee, monthly meeting of Federal Reserve regarding monetary policy (setting interest rates)
DOE: US Department of Energy
Uncle Point: or stop loss point, a level at which you’ve clearly been wrong on your position, so cry uncle and get out/wrong on your position, so cry uncle and get out!