
Wall Street continues to feel the heat coming out of the “Art of the Deal” from the White House as the trade spat with Canada continued overnight pulling European stocks down and keeping other risk assets at high volatility levels not seen for over a year. Asian stocks are likely to feel the correlated brunt on the open this morning while the flailing USD is just holding against the major undollars although Euro is outperforming again to new highs while the Australian dollar is trying in vain to get back above the 63 cent level. Expect more volatility tonight on the latest CPI print.
10 year Treasury yields dropped again with the yield curve signalling a US recession while oil prices are also under the thumb with Brent crude remaining well below the $70USD per barrel level. Gold is trying to get out of its positive alignment with risk assets and jumped back above the $2900USD per ounce level.
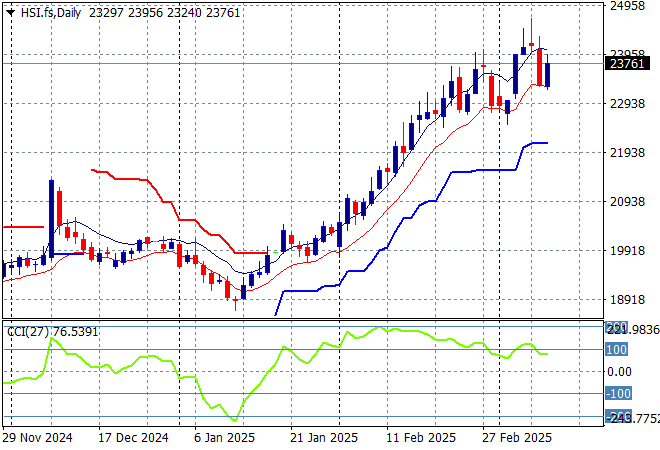
Looking at stock markets from Asia from yesterday’s session, where mainland Chinese share markets moved a little higher in afternoon trade with the Shanghai Composite up nearly 0.4% to 3379 points while the Hang Seng Index was relatively steady to close just below the 24000 point level.
The Hang Seng Index daily chart shows how this recent move looked unsustainable to the upside after recently setting up for another potential breakdown around the 20000 point level but has brushed this caution aside. Momentum remains overbought after beating the previous monthly highs at the 21500 level but as I warned last week – be cautious here in the face of another reversal:
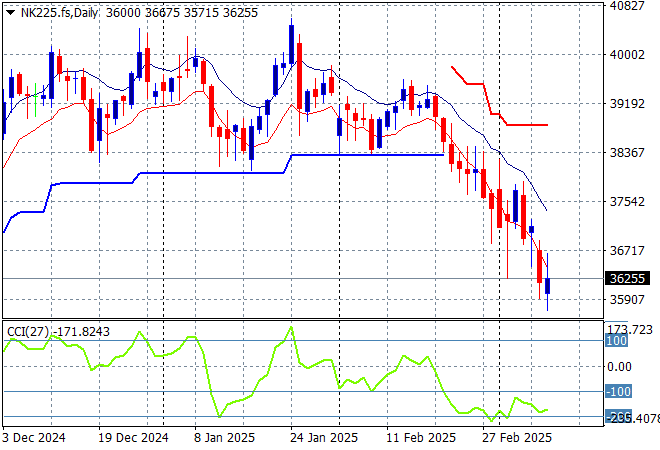
Japanese stock markets however are picking up on the selling with the Nikkei 225 down nearly 0.7% to close at 36793 points.
Price action had been indicating a rounding top on the daily chart for sometime now with daily momentum retracing away from overbought readings with the breakout last month above the 40000 point level now in full remission. Yen volatility remains a problem here, with a sustained return above the 38000 point level unlikely with futures indicating another selloff as the trading week continues to new lows:
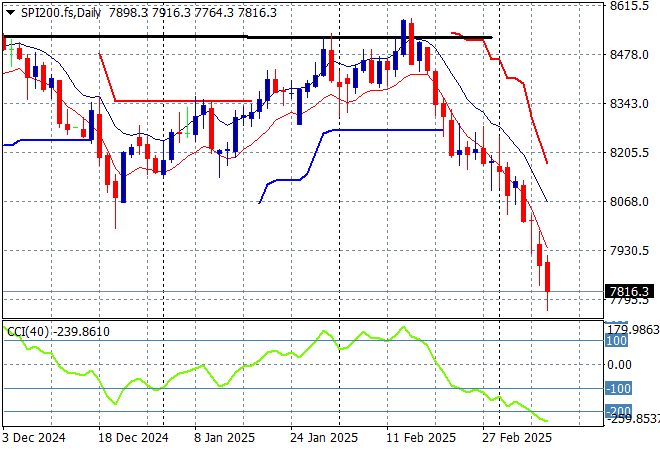
Australian stocks were again hit hard with the ASX200 closing nearly 1% lower at 7890 points.
SPI futures are down another 0.9% due to the continued uncertainty on Wall Street from overnight. The daily chart pattern suggests resistance overhead at the 8500 point level is far too heavy for the market to overcome with short term momentum oversold and ready to go lower:
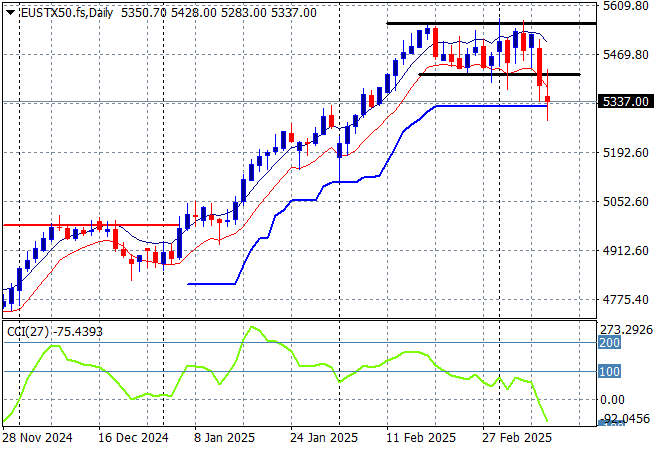
European markets had steady falling sessions across the continent, as the weight of the higher Euro and the burgeoning trade war offset the climb in defence stocks with the Eurostoxx 50 Index finishing some 1.4% lower at 5309 points.
This is setting up for a breakdown with short term support taken out and the ATR support from the recent uptrend now under threat as momentum goes into oversold mode:
Wall Street is loving the trade wars that Trump is deftly managing with his 4D chess skills as the NASDAQ managed to almost eke out a scratch session while the S&P500 lost nearly 0.8% to finish at 5572 points. Post close futures are lower however as Trump had another dummy spit in the Oval Office when the Canadians fought back with more electrical tariffs, so this is going to end well!
The Trump pump and dump scheme is working a treat here as overhead resistance rejected further calls to launch higher above that 6000 points throughout Jan and Feb with momentum now taking the market back to the September 2024 lows and possibly lower:

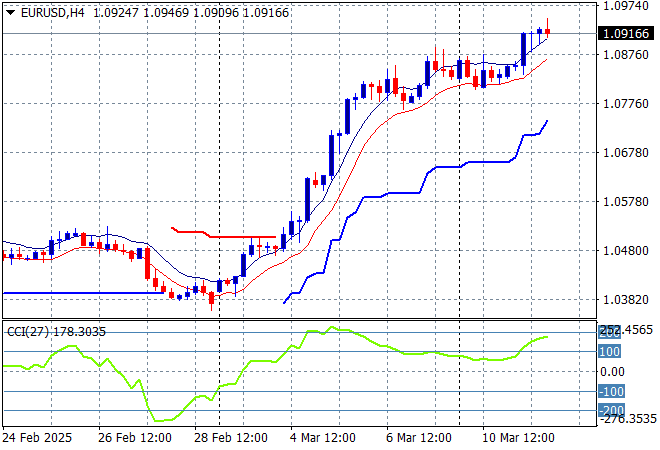
Currency markets remain strongly against King Dollar on the burgeoning trade wars with tonight’s US CPI print a key focus this week as Euro again built strongly above the 1.08 handle to extend its new monthly high into the 1.09 level itself.
The union currency surged as the bluffs were called on Trump’s tariffs, with short and medium term support building at higher levels. Momentum was overextended earlier in the week and has now re-engaged to the upside so a potential pullback move is dwindling:
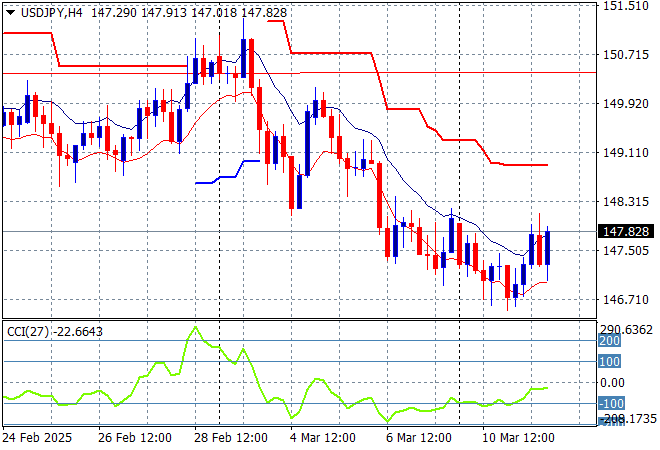
The USDJPY pair is still failing to get out of its funk after a very brief deceleration phase into the early February lows around the 151 level although short term momentum is fighting back with a further push above the 147 level overnight:
Short term momentum was extremely oversold before the start of week bounce but required price action to at least get over the 156 level to call this a proper trend higher. As USD weakens structurally overall and domestic policies continue to strengthen Yen I’ve been warning for sometime about a strong break below the 151 level:
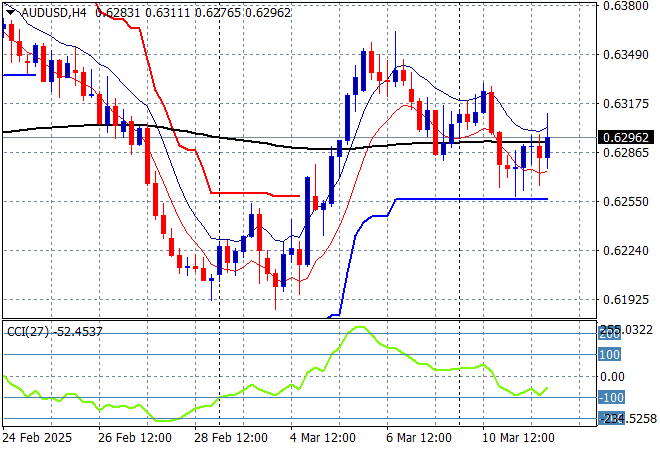
The Australian dollar is trying hard to get back into the swing of things with some recent upper movement around the 63 cent level but the risk off mood is now taking a toll with a retracement continuing below that level overnight, albeit with some strength building internally.
The recent follow through to the high 62’s and low 63’s was always high risk going into the live February RBA rate meeting and after the Trumpian tariff crusade although this bounceback could of shot over the 200 day MA (moving black line) with a clear inverted head and shoulders pattern – but did not come to pass. This is setting up for another look see at the 60 cent level:
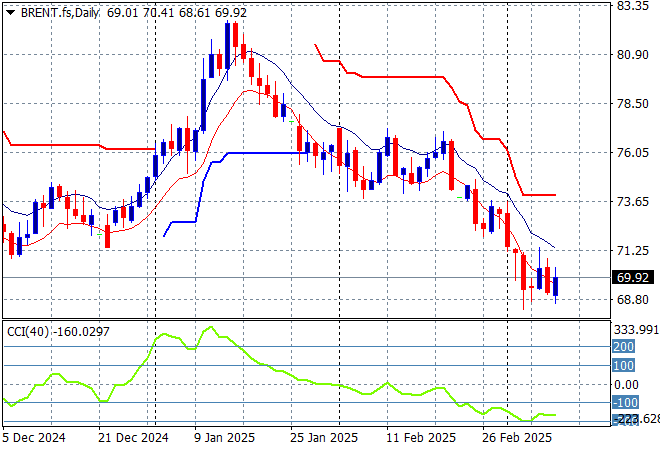
Oil markets are failing to get back on track with Brent crude pushed further down all last week with more weakness overnight as it remains firmly under the $70USD per barrel level on US recession concerns.
The daily chart pattern shows the post New Year rally that got a little out of hand and now reverting back to the sideways lower action for the latter half of 2024. The potential for a return to the 2024 lows is building here:
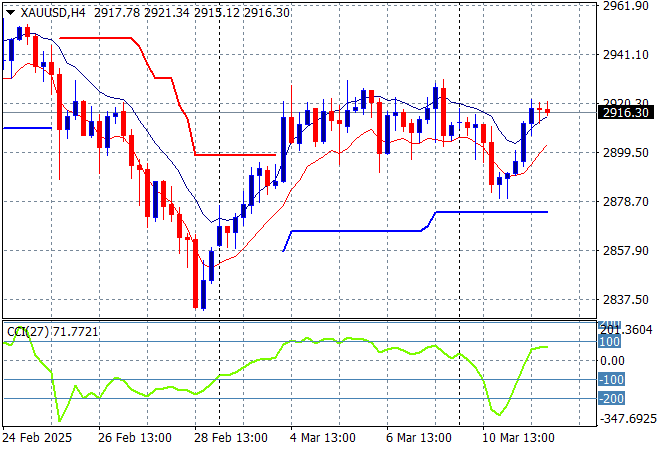
Gold has managed to get back above the $2900USD per ounce level overnight after failing to do so on the weekend gap as it tries to brush off the normal correlation with risk assets.
Price action has always found a lot of resistance just under the $2960 zone so that is the likely target in any upside potential with obvious short term resistance at the $2920 level the area to beat first:
Glossary of Acronyms and Technical Analysis Terms:
ATR: Average True Range – measures the degree of price volatility averaged over a time period
ATR Support/Resistance: a ratcheting mechanism that follows price below/above a trend, that if breached shows above average volatility
CCI: Commodity Channel Index: a momentum reading that calculates current price away from the statistical mean or “typical” price to indicate overbought (far above the mean) or oversold (far below the mean)
Low/High Moving Average: rolling mean of prices in this case, the low and high for the day/hour which creates a band around the actual price movement
FOMC: Federal Open Market Committee, monthly meeting of Federal Reserve regarding monetary policy (setting interest rates)
DOE: US Department of Energy
Uncle Point: or stop loss point, a level at which you’ve clearly been wrong on your position, so cry uncle and get out/wrong on your position, so cry uncle and get out!